Visa (NYSE:) Technical Analysis: Earnings in Focus as Bullish Momentum Builds
$364.68
28 Jul 2026, 15:59
Neutral

Join Minipip Academy and access free courses in investing, trading, economics, and more.
Sign Up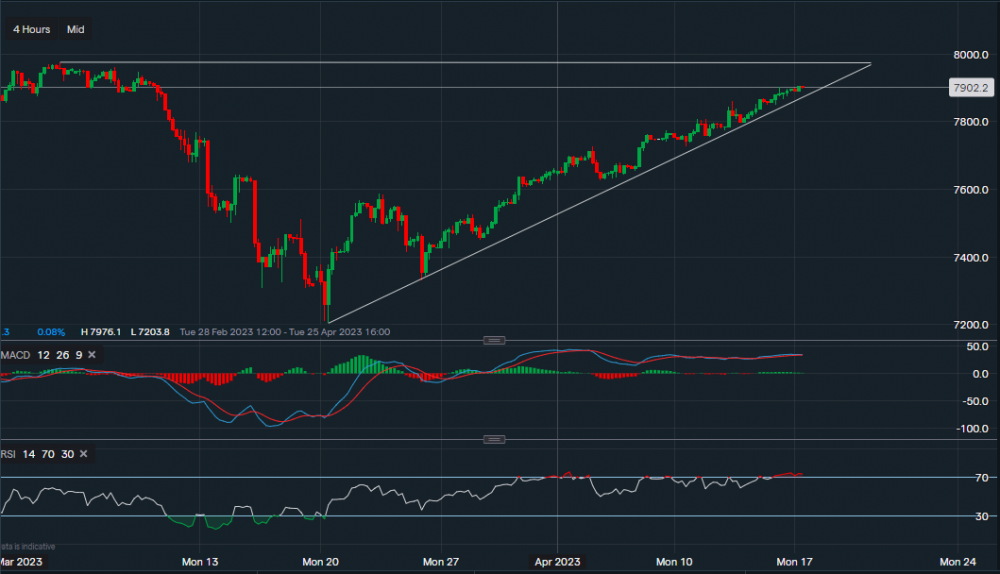
Chart & Data from IG
The FTSE 100 index is currently trading at around 7904. From a technical aspect, we can see the steep bullish trend it has been on since 20th of March. Still gradually rising along the ascending trendline, with support sitting firmly below. Support is sitting at 7885, which is along the trendline. A break and close below this trendline may see the index retrace further towards 7851 then 7796. A fall below 7796 could see a further decline towards 7727 followed by 7630. Towards the upside, resistance major resistance sits at 7976, highlighted by the horizontal trendline. A break above this level may see the FTSE edge back up towards its all-time high set in February. Looking at the technical indicators, MACD is neutral and RSI is positive as it reads 75. Although RSI is suggesting ‘overbought’ conditions. Therefore, investors should be wary when placing trades as a retracement could occur.
 Earnings Calendar
  Economic Calendar
  VAT Calculator
  Tax Free Childcare Calculator
 Percentage Calculator
 Compound Interest Calculator
  Loan Overpayment Calculator
 Mortgage Calculator
 Credit Card Calculator
 Investing
  Economics
 Trading
  Technical Analysis
  Personal Finance
 Calculator


