UnitedHealth Group Analysis: Defensive Healthcare Scale Amid Regulatory and Margin Pressures
$407.34
12 Jun 2026, 17:06
Neutral

Join Minipip Academy and access free courses in investing, trading, economics, and more.
Sign Up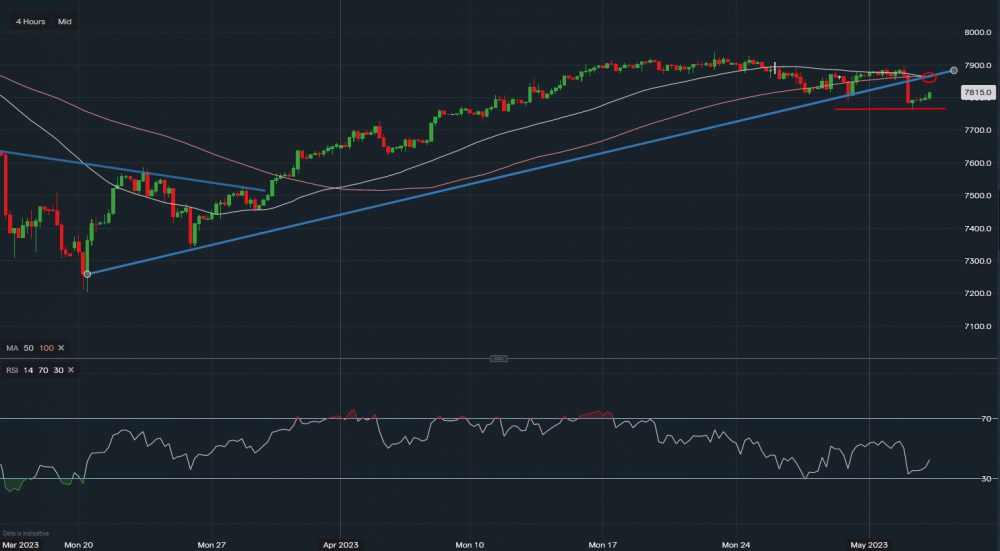
FTSE 100 - Chart & Data from IG
The FTSE looks to bounce to resistance above 7,858 but may struggle at that level. Support for the index sits at yesterday's low of 7,768, a further breakdown here could see the index fall much lower towards 7,700. It's worth noting that the 50 & 100 SMAs have just crossed over and trendline resistance was clearly broken yesterday, however, a bounce seems plausible towards that resistance at 7,858. A break above here would be very positive and with FOMC later that could be possible however, major risks do weigh in fundamentally. Banking may see a benefit from further rate hikes, however, oil & gas giants are 'under pressure' as performance is not matching that of 2022 when prices were at record highs, therefore, share prices are readjusting to the current environment which is making it very difficult in the short term to determine the true direction of the FTSE. On the technical aspect, a bounce followed by either resistance at the said level above or consolidation sees most likely right now.
 Earnings Calendar
  Economic Calendar
  VAT Calculator
  Tax Free Childcare Calculator
 Percentage Calculator
 Compound Interest Calculator
  Loan Overpayment Calculator
 Mortgage Calculator
 Credit Card Calculator
 Investing
  Economics
 Trading
  Technical Analysis
  Personal Finance
 Calculator


