Visa (NYSE:) Technical Analysis: Earnings in Focus as Bullish Momentum Builds
$364.68
28 Jul 2026, 15:59
Neutral

Join Minipip Academy and access free courses in investing, trading, economics, and more.
Sign Up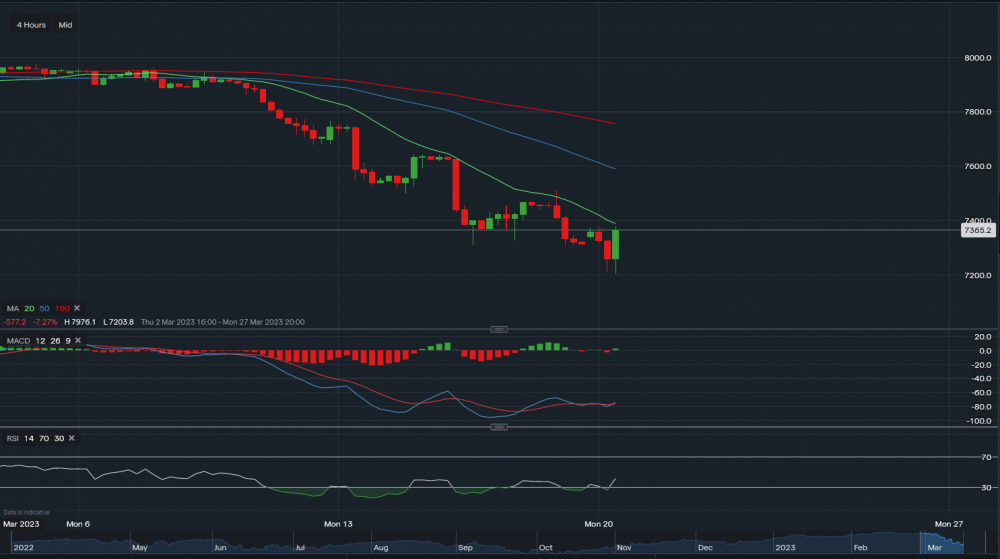
Chart & Data from IG
FTSE100 currently trading at around 7,365. The index has experienced a huge sell-off due to the pressure of the current banking crisis, impacted by the decline in HSBC’s stock price in particular. However, we can see that a strong candlestick on the 4-hourly timeframe has appeared and will potentially test the resistance sitting at 7,388 (20-day moving average). A break above the 20-day MA could see the index edge higher over the course of this week, towards the resistance levels currently at 7,589 (50-day MA) and then at 7,756 (100-day MA). Although, this will be very much dependent on the economic data which is scheduled for this week. UK’s CPI figures are due on Wednesday in pre-market along with the US Federal Reserve’s interest rate decision in later trading. The Bank of England interest rate decision is due on Thursday; hence, investors should be extremely cautious this week as plenty of volatility is upcoming. At this moment in time, major support sits at 7,203. A break below this point may see the index decline further towards the 7,000 level. The MACD is neutral and RSI is negative as it reads 40. But, the RSI has suggested on a couple of occasions that the index is trading in oversold conditions, therefore, there is potential for some consolidation before the economic data is released.
 Earnings Calendar
  Economic Calendar
  VAT Calculator
  Tax Free Childcare Calculator
 Percentage Calculator
 Compound Interest Calculator
  Loan Overpayment Calculator
 Mortgage Calculator
 Credit Card Calculator
 Investing
  Economics
 Trading
  Technical Analysis
  Personal Finance
 Calculator


