UnitedHealth Group Analysis: Defensive Healthcare Scale Amid Regulatory and Margin Pressures
$407.34
12 Jun 2026, 17:06
Neutral

Join Minipip Academy and access free courses in investing, trading, economics, and more.
Sign Up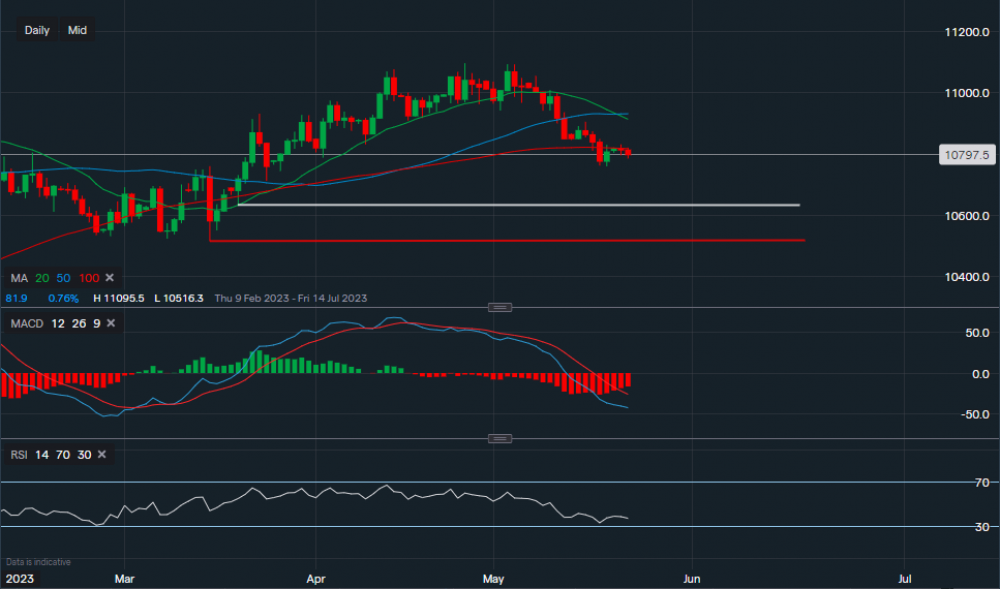
Chart & Data from IG
Taking a quick look at the euro versus the dollar, the Euro is currently trading at around €1.0797 against the dollar. We can see that on the daily timeframe that the price has now dipped below the 100-day moving average, further support sits at €1.0631 (white trendline). A break below the white trendline could see the price retrace lower towards the key level sitting at €1.0516 (red trendline). Towards the upside, the previous support along the 100-day MA is now acting as resistance at €1.0817. A move above the 100-day MA may see the euro climb back up to roughly the €1.0900 level. Looking at the technical indicators, the MACD remains strongly negative and so is the RSI as it reads 37.

Tradable assets:
Min.Deposit:
Max Leverage:
FCA:

Rating:
 Earnings Calendar
  Economic Calendar
  VAT Calculator
  Tax Free Childcare Calculator
 Percentage Calculator
 Compound Interest Calculator
  Loan Overpayment Calculator
 Mortgage Calculator
 Credit Card Calculator
 Investing
  Economics
 Trading
  Technical Analysis
  Personal Finance
 Calculator


