UnitedHealth Group Analysis: Defensive Healthcare Scale Amid Regulatory and Margin Pressures
$407.34
12 Jun 2026, 17:06
Neutral

Join Minipip Academy and access free courses in investing, trading, economics, and more.
Sign Up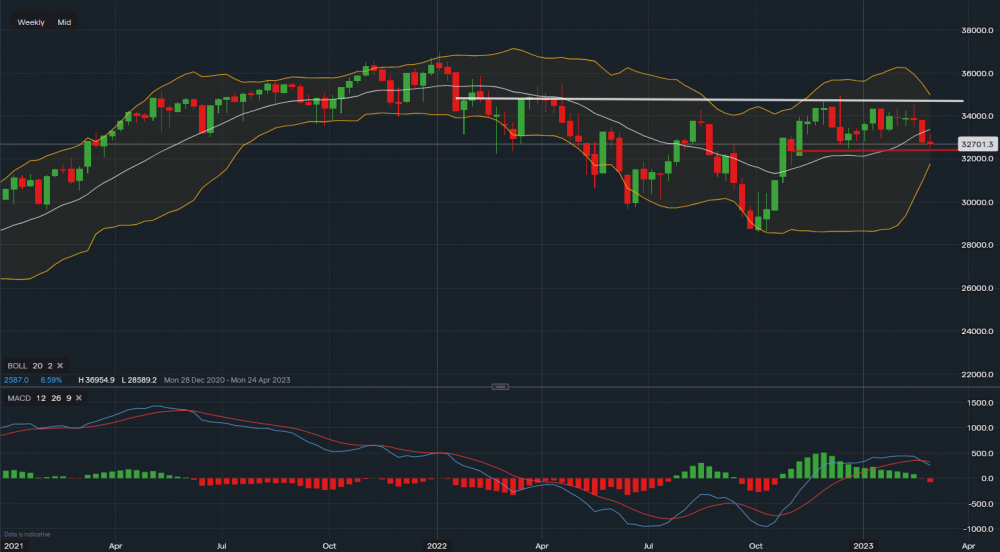
Dow Jones - Chart & Data from IG
The Dow Jones continues to stay rangebound with tough resistance at 34,600 and support at 32,500. Despite the index being rangebound the index tilts towards the downside as MACD is currently negative and the price sits in the lower Bollinger band. This suggests a possible break lower out of the consolidation and a move down to the lower band value of 31,700. RSI currently reads 45, suggesting a neutral stance. Taking a look at the chart, support in the short term for the Dow Jones sits at the trendline low of 32,500 followed by 31,700. A break of this level could see the index fall much further and would solidify the bearish stance in the short term. Towards the upside, resistance for the index sits at 33,380 followed by 34,600 and 35,000. Similar to the S&P500 the Dow Jones is likely going to need to see some positive data from the USA for a sustained move higher, else wise consolidation looks to be in place for the short term.
 Earnings Calendar
  Economic Calendar
  VAT Calculator
  Tax Free Childcare Calculator
 Percentage Calculator
 Compound Interest Calculator
  Loan Overpayment Calculator
 Mortgage Calculator
 Credit Card Calculator
 Investing
  Economics
 Trading
  Technical Analysis
  Personal Finance
 Calculator


