UnitedHealth Group Analysis: Defensive Healthcare Scale Amid Regulatory and Margin Pressures
$407.34
12 Jun 2026, 17:06
Neutral

Join Minipip Academy and access free courses in investing, trading, economics, and more.
Sign Up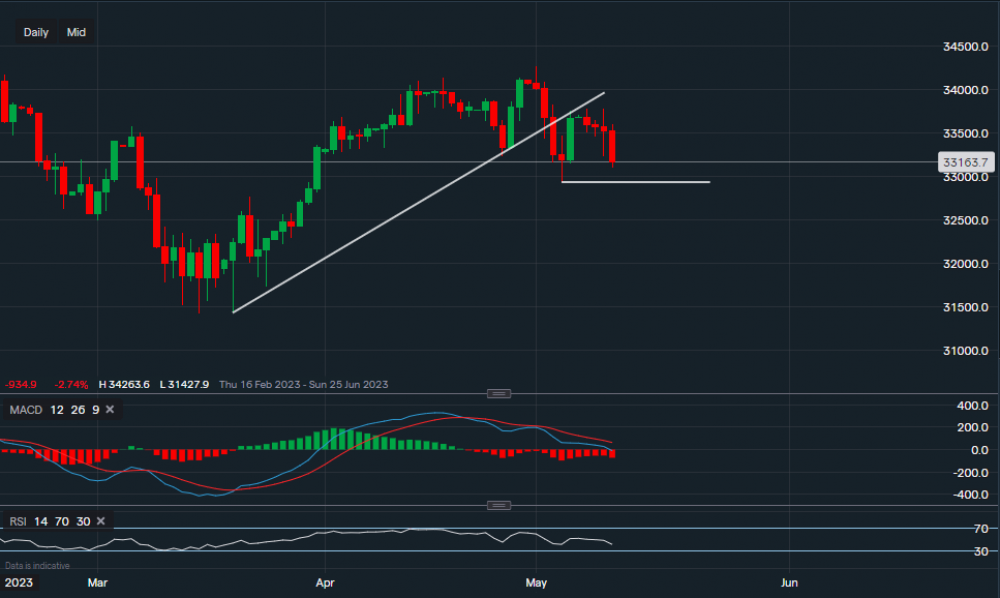
Chart & Data from IG
Taking a look at the Dow Jones after Disney is weighing it down, Disney is currently down over 8% which is having a partial negative impact on the index. Currently trading at around 33,163, looking on the daily interval, we can see that last week the bullish trend was broken and this week the resistance was too overpowering (ascending trendline). The Dow is now approaching the support level at 32,934 (highlighted by the horizontal trendline). A break below 32,934 could see a decline lower towards 32,495. If the index consolidates around 32,934, we can then look towards the upside with resistance levels at 33,358 followed by 33,577. A move above 33,577 could see a rise higher towards 33,750. Over to the indicators, MACD remains negative and RSI is faltering as it now reads 42.

Tradable assets:
Min.Deposit:
Max Leverage:
FCA:

Rating:
 Earnings Calendar
  Economic Calendar
  VAT Calculator
  Tax Free Childcare Calculator
 Percentage Calculator
 Compound Interest Calculator
  Loan Overpayment Calculator
 Mortgage Calculator
 Credit Card Calculator
 Investing
  Economics
 Trading
  Technical Analysis
  Personal Finance
 Calculator


