Visa (NYSE:) Technical Analysis: Earnings in Focus as Bullish Momentum Builds
$364.68
28 Jul 2026, 15:59
Neutral

Join Minipip Academy and access free courses in investing, trading, economics, and more.
Sign Up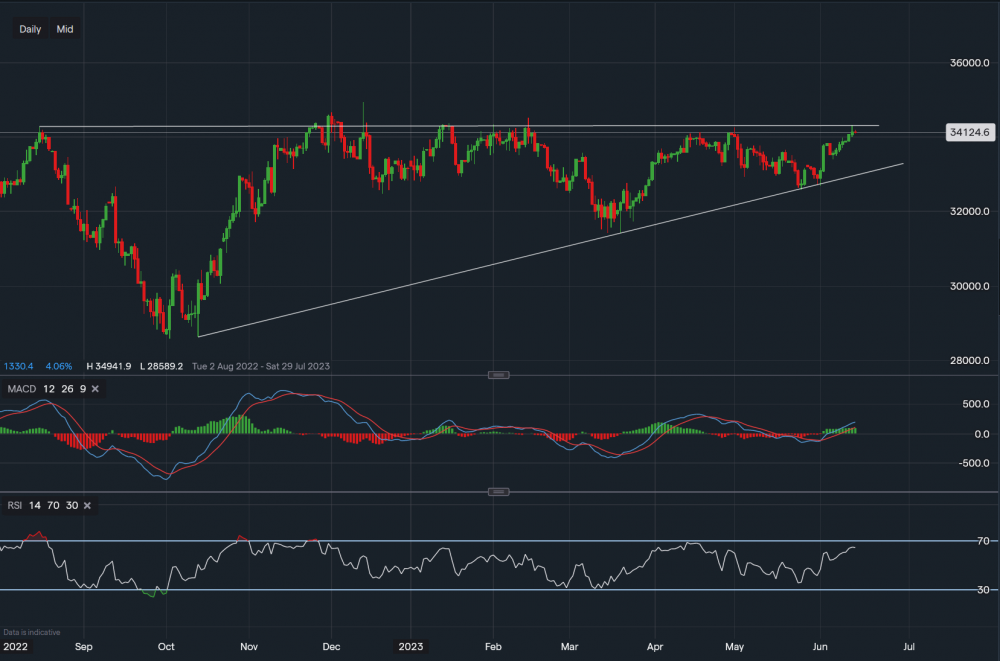
Chart & Data from IG
We can see that on the daily timeframe, the Dow Jones has been in this bull trend since October of last year, now currently trading at around 34,124. It has once again approached a tough resistance point of 34,285 (upper trendline). The index has tried to break through and consolidate above this level on 3 other occasions, pulling back every time. There may be another attempt over the next couple of days as the Federal Reserve Bank will release its decision today on the future of its rate hiking spree. Markets and investors are pricing in a pause on the rates, backed by soft inflation data which was released yesterday. However, there are still some concerns as the Bank of Australia raised rates once again and the European central bank is expected to follow suit. Though a positive outcome could see the index climb higher towards the resistance around the 34,600 mark. Towards the downside, support is established along the ascending trendline, with the first key level at 33,192. A break and close below this level may see the index slide lower towards 32,681 and then 32,584. Looking at the technical indicators, MACD is positive and so is the RSI as it reads 64.

Tradable assets:
Min.Deposit:
Max Leverage:
FCA:

Rating:
 Earnings Calendar
  Economic Calendar
  VAT Calculator
  Tax Free Childcare Calculator
 Percentage Calculator
 Compound Interest Calculator
  Loan Overpayment Calculator
 Mortgage Calculator
 Credit Card Calculator
 Investing
  Economics
 Trading
  Technical Analysis
  Personal Finance
 Calculator


