Visa (NYSE:) Technical Analysis: Earnings in Focus as Bullish Momentum Builds
$364.68
28 Jul 2026, 15:59
Neutral

Join Minipip Academy and access free courses in investing, trading, economics, and more.
Sign Up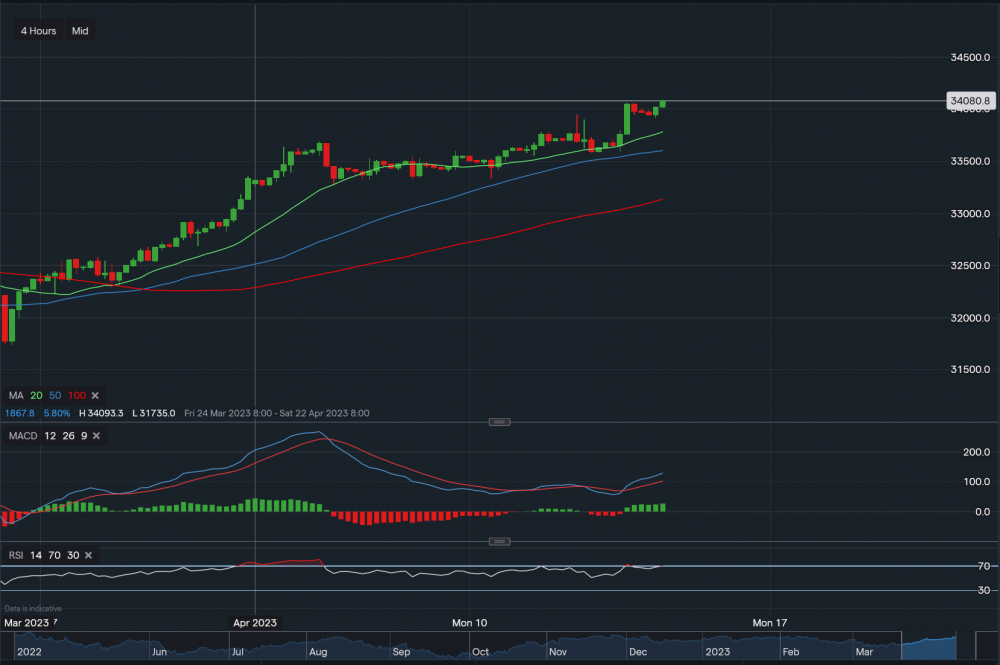
Chart & Data from IG
The Dow Jones seems to be continuing the momentum from yesterday’s trading session in the pre-market trading. From a technical aspect, currently trading at around 34,080. Looking at the 4 hourly timeframe, support sits below at 33,909 then at 33,781 (20-day MA) then at 33,601 (50-day MA). A break below the 50-day moving average could see the index retrace further towards the base that was created last week (ranging between 33,274-33,331). Towards the upside, the index has broken through the 34,053 resistance, so a close above this price may see it edge higher at the open. With the target near the 34200 level. MACD is positive as is RSI as it reads 69. Although, RSI is floating just below ‘overbought’ territory. Additionally, investors should be wary of the US core retail sales due at 13:30 GMT. As the data might have an influence on the markets.
 Earnings Calendar
  Economic Calendar
  VAT Calculator
  Tax Free Childcare Calculator
 Percentage Calculator
 Compound Interest Calculator
  Loan Overpayment Calculator
 Mortgage Calculator
 Credit Card Calculator
 Investing
  Economics
 Trading
  Technical Analysis
  Personal Finance
 Calculator


