UnitedHealth Group Analysis: Defensive Healthcare Scale Amid Regulatory and Margin Pressures
$407.34
12 Jun 2026, 17:06
Neutral

Join Minipip Academy and access free courses in investing, trading, economics, and more.
Sign Up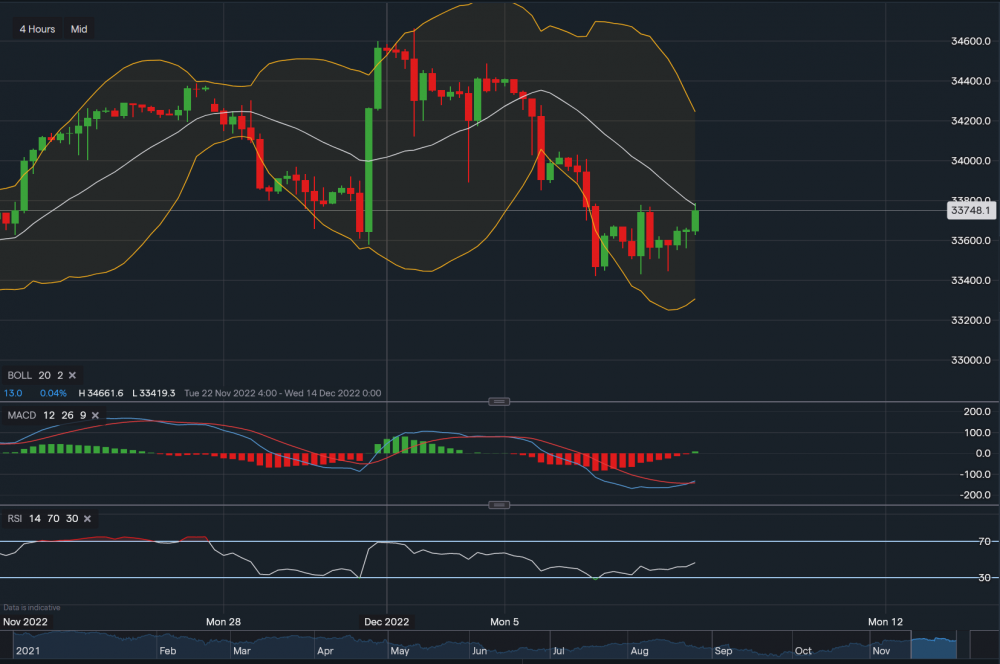
From a technical aspect, the Dow Jones index is currently trading at 33748. Applying the Bollinger Bands to the chart, the index seems like it is trying to break out of the 5-day losing streak. Resistance sits at 33777 (middle moving average of the Bollingers) then at 33608 then at 33968. A break above 33968 could see the Dow head towards the upper Bollinger Band (34245). If resistance is overpowering, on the downside support sits at 33655 then at 33608 then at 33577. A break below these points may see the index continue its losing streak towards the 33300-33400 level (correspondent with the lower Bollinger Band). Looking at the indicators, MACD has just turned positive and RSI is neutral as it reads 47.
 Earnings Calendar
  Economic Calendar
  VAT Calculator
  Tax Free Childcare Calculator
 Percentage Calculator
 Compound Interest Calculator
  Loan Overpayment Calculator
 Mortgage Calculator
 Credit Card Calculator
 Investing
  Economics
 Trading
  Technical Analysis
  Personal Finance
 Calculator


