UnitedHealth Group Analysis: Defensive Healthcare Scale Amid Regulatory and Margin Pressures
$407.34
12 Jun 2026, 17:06
Neutral

Join Minipip Academy and access free courses in investing, trading, economics, and more.
Sign Up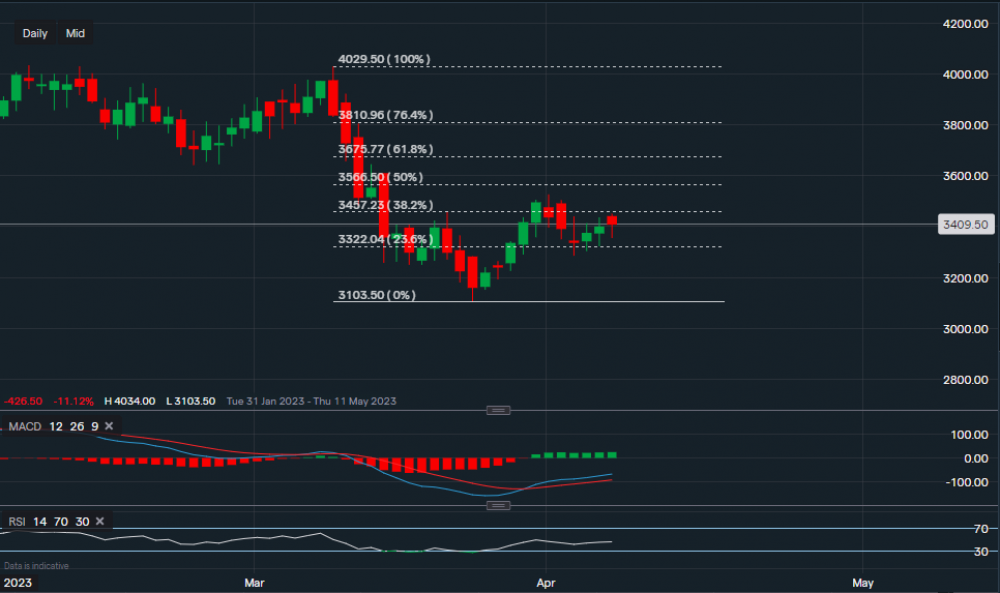
Chart & Data from IG
With the summer season approaching, more people travel across the world usually during this period which could bring more business to airlines. Taking some pressure from the ones that have been hit hard in the last 12 months. Taking a look at Delta Airlines in regard to the above, its stock price currently sits around $34.09 a share. Applying the Fibonacci retracement to the chart, we can see the stock has found a bottom and formed a slight base at $31.03. The first line of support currently sits at $33.22 (23.6% fib) followed by the key level at $31.03 (aka bottom base). A break below this key level could see the price slide much further towards the lows of September last year ($27-28). As the price is steadily approaching the $34.57 (38.2% fib) resistance level, which it failed to move and close above last week, a new progressive move may see a follow through towards the next resistance sitting at $35.66 (50% fib). The company is expected to report quarterly earnings on Thursday and a good report could really provide the backbone for this stock, in order to regain some of the losses from 2022. The indicators are mixed at this moment in time, with the MACD positive and RSI just turning neutral.
 Earnings Calendar
  Economic Calendar
  VAT Calculator
  Tax Free Childcare Calculator
 Percentage Calculator
 Compound Interest Calculator
  Loan Overpayment Calculator
 Mortgage Calculator
 Credit Card Calculator
 Investing
  Economics
 Trading
  Technical Analysis
  Personal Finance
 Calculator


