Visa (NYSE:) Technical Analysis: Earnings in Focus as Bullish Momentum Builds
$364.68
28 Jul 2026, 15:59
Neutral

Join Minipip Academy and access free courses in investing, trading, economics, and more.
Sign Up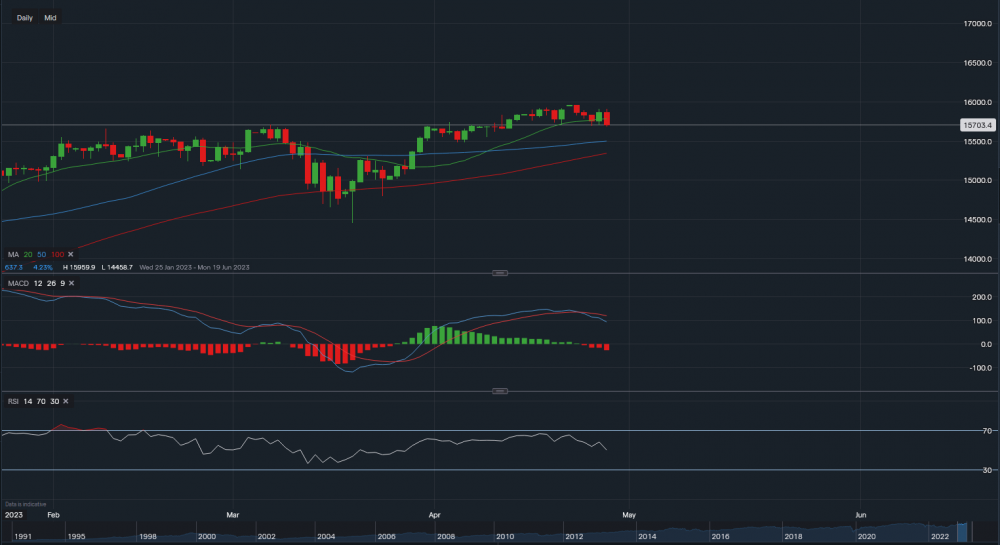
Chart & Data from IG
The Dax has just dipped below the 20-day moving average (15,785) on the daily timeframe, currently trading at around 15,703. Though the index does have support below sitting at 15,449 (100-day MA) followed by 15,343 (100-day MA). A dip below 15,343 could see the index slide further towards 15,011. Previous support of 15,785 is now acting as resistance, a break above this point would see further resistance levels at 15,913 then a key level at 15,959. A break above 15,959 may see the Dax edge higher towards 16,100-16,200. Looking at the technical indicators, MACD has turned negative and RSI is now faltering as it reads 49.
 Earnings Calendar
  Economic Calendar
  VAT Calculator
  Tax Free Childcare Calculator
 Percentage Calculator
 Compound Interest Calculator
  Loan Overpayment Calculator
 Mortgage Calculator
 Credit Card Calculator
 Investing
  Economics
 Trading
  Technical Analysis
  Personal Finance
 Calculator


