Visa (NYSE:) Technical Analysis: Earnings in Focus as Bullish Momentum Builds
$364.68
28 Jul 2026, 15:59
Neutral

Join Minipip Academy and access free courses in investing, trading, economics, and more.
Sign Up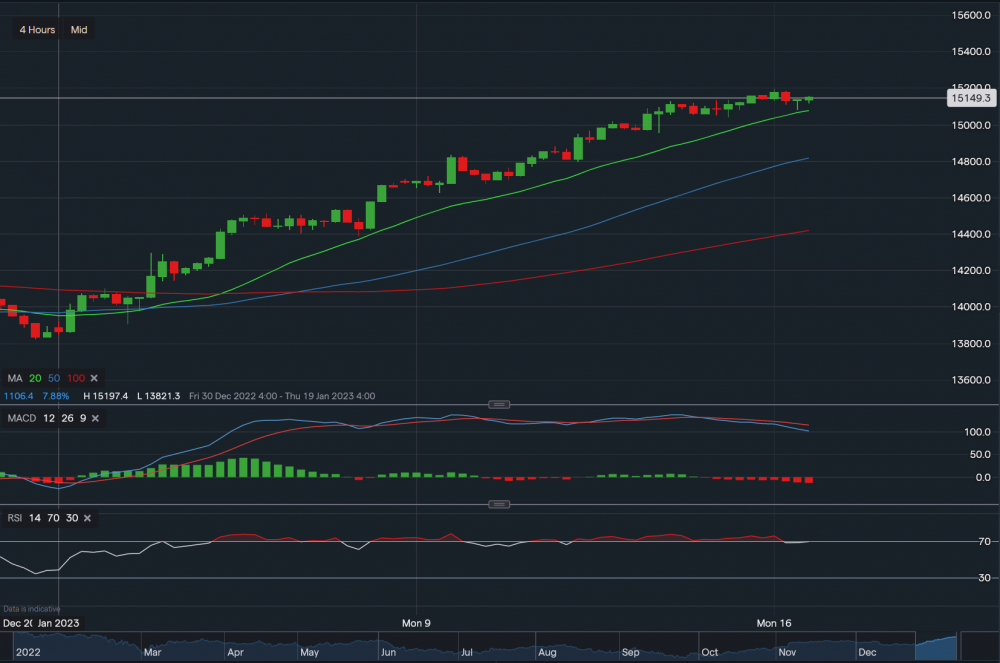
Dax 40 - Chart & Data from IG
From a technical perspective, the DAX is currently trading at around 15,149. Looking at the 4-hourly timeframe, support sits below at 15,081 (20-day MA). A break below the 20-day MA may see the index fall, testing support levels at 14,953 and then at 14,800 (50-day MA). A break below the 50-day MA could result in a much deeper fall towards the 100-day MA (14,600), although this is more likely towards the back end of the week. On the other hand, towards the upside, resistance sits at 15,186 then a key level at 15,197. A break above 15,197 could see the Dax climb towards 15,300-15,400. Looking at the technical indicators, MACD is currently negative but RSI is positive as it reads 69. NOTE: RSI has been in or floating under the 'overbought’ territory since January 4th. It is also in the overbought territory on a daily timeframe, therefore, important for bulls to factor this in when placing trades.
 Earnings Calendar
  Economic Calendar
  VAT Calculator
  Tax Free Childcare Calculator
 Percentage Calculator
 Compound Interest Calculator
  Loan Overpayment Calculator
 Mortgage Calculator
 Credit Card Calculator
 Investing
  Economics
 Trading
  Technical Analysis
  Personal Finance
 Calculator


