UnitedHealth Group Analysis: Defensive Healthcare Scale Amid Regulatory and Margin Pressures
$407.34
12 Jun 2026, 17:06
Neutral

Join Minipip Academy and access free courses in investing, trading, economics, and more.
Sign Up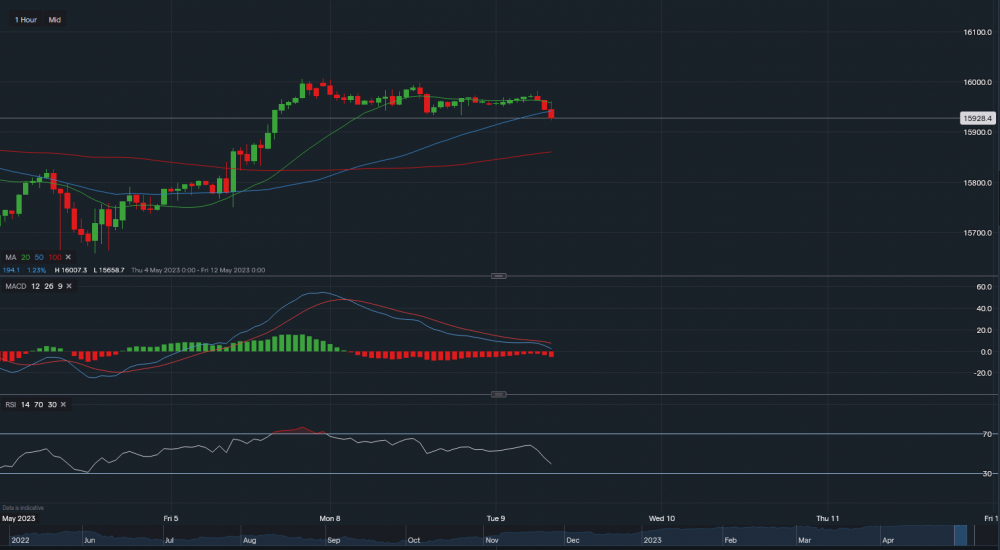
Chart & Data from IG
The Dax looks like it could pull back slightly from its recent rallies higher. Currently trading at around 15,933, it has dipped below the 50-day moving average which could be an indication for a retracement towards the 100-day MA. It has also broken through the support sitting at 15,933, although it’s not closed below it as of yet. The support along the 100-day MA reads 15,860. If the current support of 15,933 and along the 50-day MA hold, resistance above sits at 15,959 (20-day MA) followed by 15,982. A move above 15,982 could see the index climb back up towards that 16,000 mark. Looking at the indicators, MACD is still negative and RSI is neutral as it reads 45.

Tradable assets:
Min.Deposit:
Max Leverage:
FCA:

Rating:
 Earnings Calendar
  Economic Calendar
  VAT Calculator
  Tax Free Childcare Calculator
 Percentage Calculator
 Compound Interest Calculator
  Loan Overpayment Calculator
 Mortgage Calculator
 Credit Card Calculator
 Investing
  Economics
 Trading
  Technical Analysis
  Personal Finance
 Calculator


