Salesforce Stock Analysis: Technical Indicators Suggest a Potential Upside Move
$$248.22
Salesforce Stock Analysis: Technical Indicators Suggest a Potential Upside Move
16 Oct 2025, 13:05

Chart & Data from IG

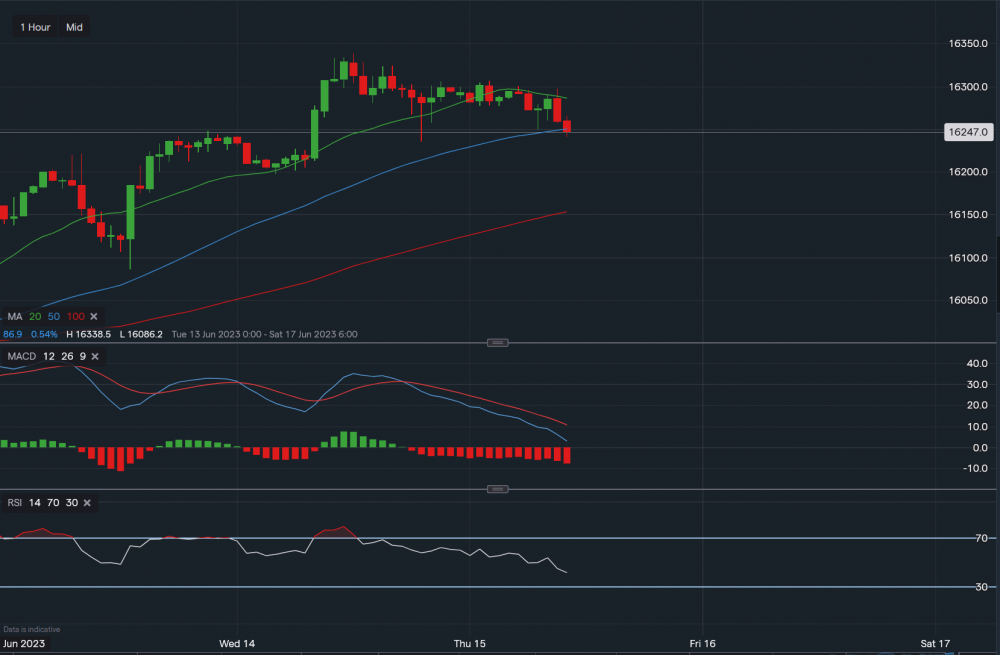
The Dax is approaching the next level of support which is along the 50-day moving average (blue). Currently trading at around 16,247, with the support at 16,250. A break and close below the moving average could see the index slide further towards 16,197 followed by 16,153 (100-day MA). On the other hand, towards the upside, the resistance is now at 16,286 (20-day MA). A break above it could see a move higher towards 16,306 and then potentially back up to the all-time high of 16,338 that was created in yesterday’s session. Looking at the technical indicators, MACD is negative and so is the RSI as it reads 41 and is faltering.