Visa (NYSE:) Technical Analysis: Earnings in Focus as Bullish Momentum Builds
$364.68
28 Jul 2026, 15:59
Neutral

Join Minipip Academy and access free courses in investing, trading, economics, and more.
Sign Up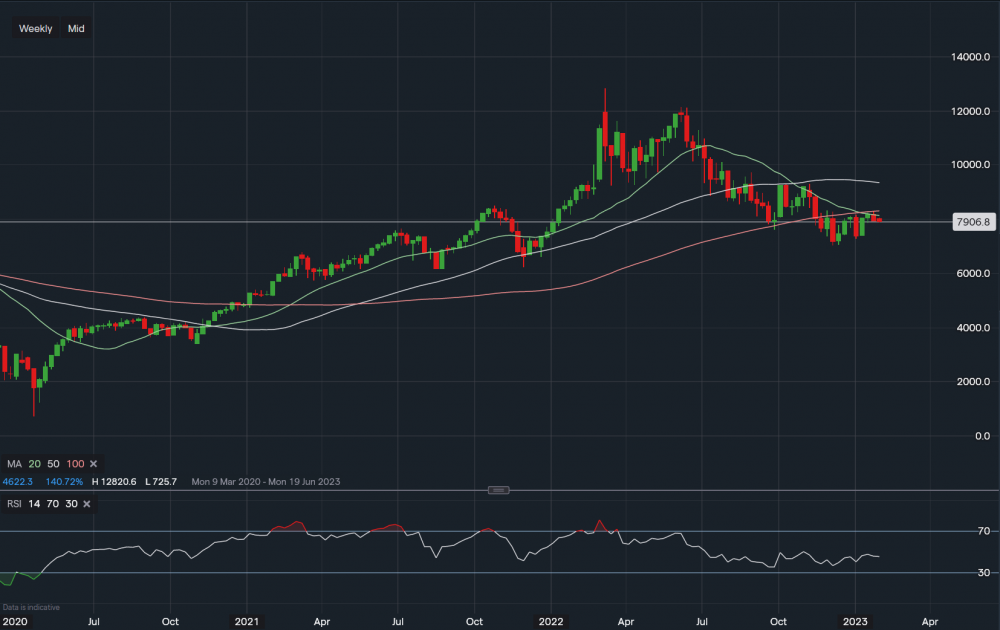
Crude Oil - Weekly - Chart Data IG
Both Crude & Brent oil are currently at an important pivot point on the weekly timeframe. This week could determine the next short-term direction. Major resistance above sits at the $81.25 region where the weekly swing highs over the last few months and 50 SMA sit. Followed by further resistance $83 region. Unless a weekly candlestick breaks and closes above here, the bias would remain rangebound for now within the $70-$80 zone. Towards the downside weekly support sits at $73.90 followed by the November 2022 low at $70.25. A drop to this level could be a good possible buying opportunity for the short term, however, is this final support were to break, oil could head much lower. MACD is trending positive and RSI reads 45, suggesting a mildly positive bias on the technical side - it is important to consider fundamental aspects this week though as they'll likely be in the driving seat for determining the next upside or downside move.
 Earnings Calendar
  Economic Calendar
  VAT Calculator
  Tax Free Childcare Calculator
 Percentage Calculator
 Compound Interest Calculator
  Loan Overpayment Calculator
 Mortgage Calculator
 Credit Card Calculator
 Investing
  Economics
 Trading
  Technical Analysis
  Personal Finance
 Calculator


