UnitedHealth Group Analysis: Defensive Healthcare Scale Amid Regulatory and Margin Pressures
$407.34
12 Jun 2026, 17:06
Neutral

Join Minipip Academy and access free courses in investing, trading, economics, and more.
Sign Up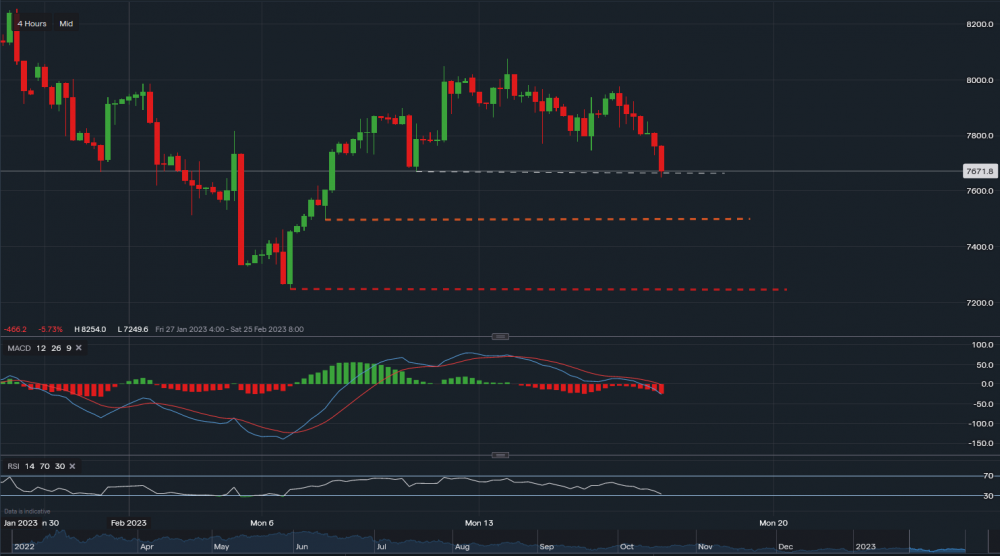
Crude Oil - Chart & Data from IG
We can see that Crude has dipped below the next line of support on the 4-hour timeframe, the support is sitting at $76.69. A close below this support level could see its price fall towards the next levels sitting at $74.97 followed by $72.49. The $72.49 is the key level to the recent bullish movements, a break below it could see the price plummet as far as $70 a barrel. If consolidation takes place between $75-$76, we can then look into any possible upside turns. However, until then, the bias is bearish. The hawkish comments from Fed members and hotter inflation data have placed some concerns on the future of interest rates, as a result, it's strengthening the dollar and weakening the price of crude. Both of the technical indicators currently suggest more downside, with MACD negative and RSI reading 33. Although, RSI is floating just above 'oversold' territory.
 Earnings Calendar
  Economic Calendar
  VAT Calculator
  Tax Free Childcare Calculator
 Percentage Calculator
 Compound Interest Calculator
  Loan Overpayment Calculator
 Mortgage Calculator
 Credit Card Calculator
 Investing
  Economics
 Trading
  Technical Analysis
  Personal Finance
 Calculator


