Salesforce Stock Analysis: Technical Indicators Suggest a Potential Upside Move
$$248.22
Salesforce Stock Analysis: Technical Indicators Suggest a Potential Upside Move
16 Oct 2025, 13:05

Chart & Data from IG

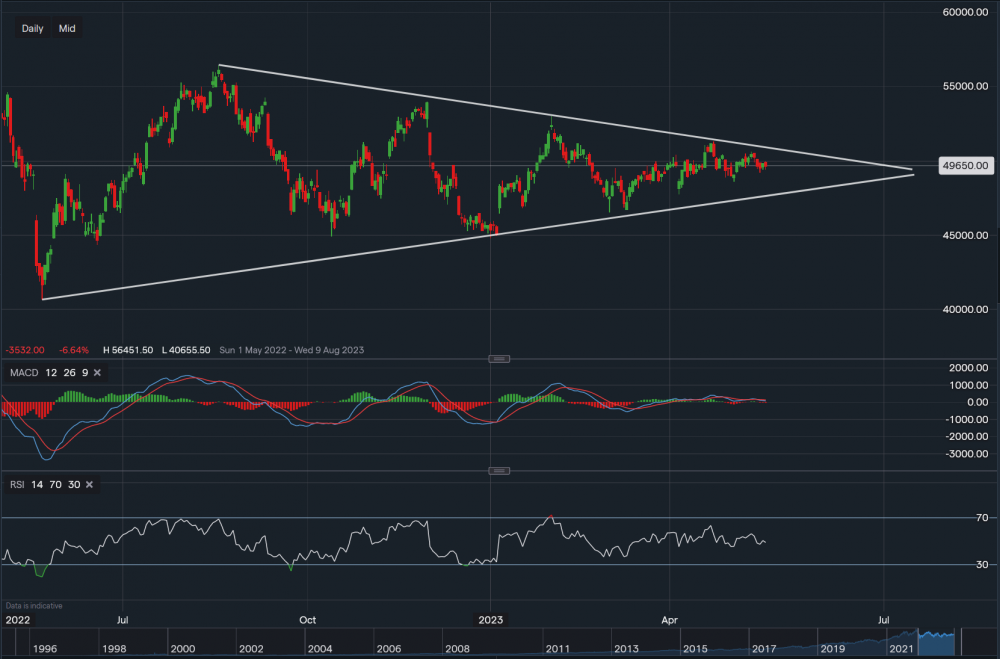
Analysing Costco’s stock as the giant retailer is releasing earnings this Thursday (25h of May). From a technical perspective, we can see that the price has formed a symmetrical triangle on the daily timeframe. The share price is currently sitting around $496.50 a share, but this should remain fairly neutral until the release of the earnings report. We can see the various support levels below, with the first support at $485.74 followed by a key support level at $479.07 (along the ascending trendline). Towards the upside, resistance sits at $507.13 which is located along the descending trendline. A break above this price level may see the price rise higher towards $513.14. The technical indicators are suggesting a mixed outlook, with the MACD negative but the RSI neutral as it reads 48.
Note: Investors and traders should be cautious as the earnings report can have an influence on the direction of the price.