Visa (NYSE:) Technical Analysis: Earnings in Focus as Bullish Momentum Builds
$364.68
28 Jul 2026, 15:59
Neutral

Join Minipip Academy and access free courses in investing, trading, economics, and more.
Sign Up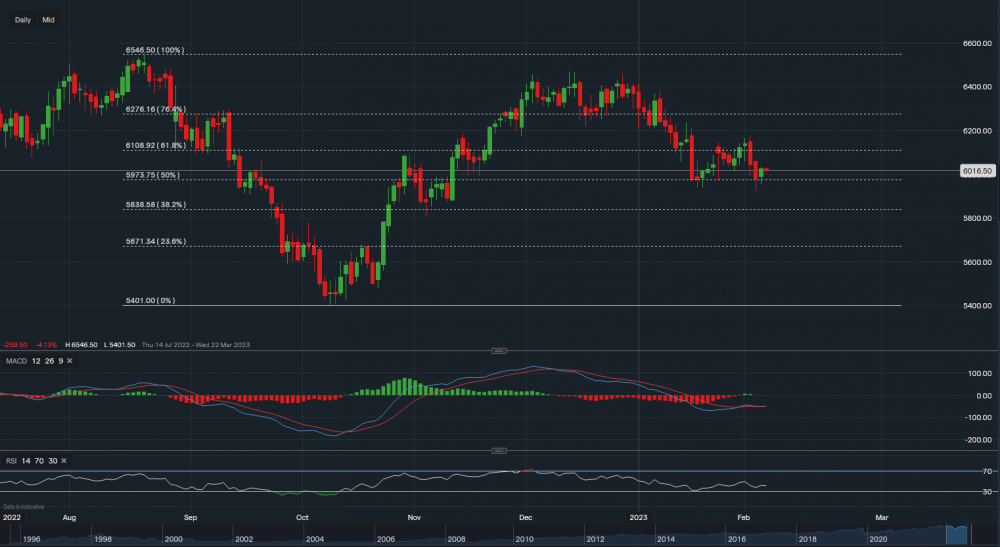
Coca-Cola - Chart & Data from IG
Financials
Looking at the beverage giant Coca-Cola, in its financial year of 2021 it reported $38.6bn in revenue and $23.3bn in gross profit. Currently operating at a 60% profit margin which is outstanding business. Its operating expenses did rise by around $1.5bn YoY but net still came in at $2bn higher than in the previous year. Additionally, due to the brilliant profit margin and yearly increases regarding EBITDA, earnings per share grew 25% in 2021. This was the biggest set of earnings for the company since 2010. Over to the balance sheet, cash-on-hand sits at $12.6bn with total assets at $94.3bn and total liabilities at $69.5bn. The rise in assets overshadowed the rise in liabilities, which contributed to the growth in equity by $3.6bn to $24.8bn. However, still a chunk off the levels seen back in the early years of the last decade ($30-$33bn).
Technicals
From a technical outlook, Coca-Cola’s stock is currently trading at $60.16 a share. We can see that an attempt to reach $65.46 (100% Fib) was made in December but failed to get close enough. Since then, the price has retreated towards $59.73 (50% Fib) which is acting as support. Further below, support levels also sit at $58.38 (38.2% Fib) and then at $56.71 (23.6% FIb). Towards the upside, resistance sits at $61.08 (61.8% FIb) then at $62.76 (76.4% Fib) then the key level at $65.46. A break above the key resistance could see the price of this stock rise as high as $67 a share. MACD is currently neutral and RSI is flat but negative as it reads 40.
 Earnings Calendar
  Economic Calendar
  VAT Calculator
  Tax Free Childcare Calculator
 Percentage Calculator
 Compound Interest Calculator
  Loan Overpayment Calculator
 Mortgage Calculator
 Credit Card Calculator
 Investing
  Economics
 Trading
  Technical Analysis
  Personal Finance
 Calculator


