UnitedHealth Group Analysis: Defensive Healthcare Scale Amid Regulatory and Margin Pressures
$407.34
12 Jun 2026, 17:06
Neutral

Join Minipip Academy and access free courses in investing, trading, economics, and more.
Sign Up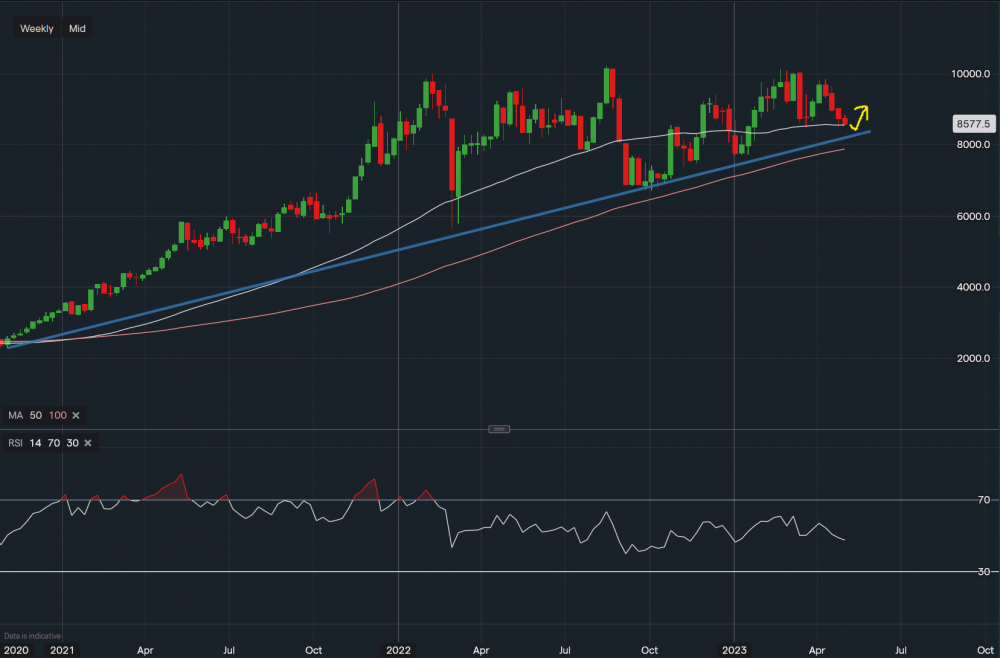
Carbon Emissions - Chart Data IG
Carbon (EU ETS) continues to drop in the short term, however, long-term support still holds strong. The RSI on the weekly timeframe reads 47 with MACD currently negative. However, Support from the 50 & 100 SMAs along with the 3-year trendline currently sits at €85.81 (50SMA), €81.40 (blue trendline) and €78.90 (100SMA). A further break of the 100SMA & Trendline could be very bearish for the commodity token, however until this level of support is broken, things remain okay for now. Towards the upside, the major resistance is €100.00 which will be very hard to break. In the short term €90.00 to €91.60 remains the first resistance zone.
 Earnings Calendar
  Economic Calendar
  VAT Calculator
  Tax Free Childcare Calculator
 Percentage Calculator
 Compound Interest Calculator
  Loan Overpayment Calculator
 Mortgage Calculator
 Credit Card Calculator
 Investing
  Economics
 Trading
  Technical Analysis
  Personal Finance
 Calculator


