Visa (NYSE:) Technical Analysis: Earnings in Focus as Bullish Momentum Builds
$364.68
28 Jul 2026, 15:59
Neutral

Join Minipip Academy and access free courses in investing, trading, economics, and more.
Sign Up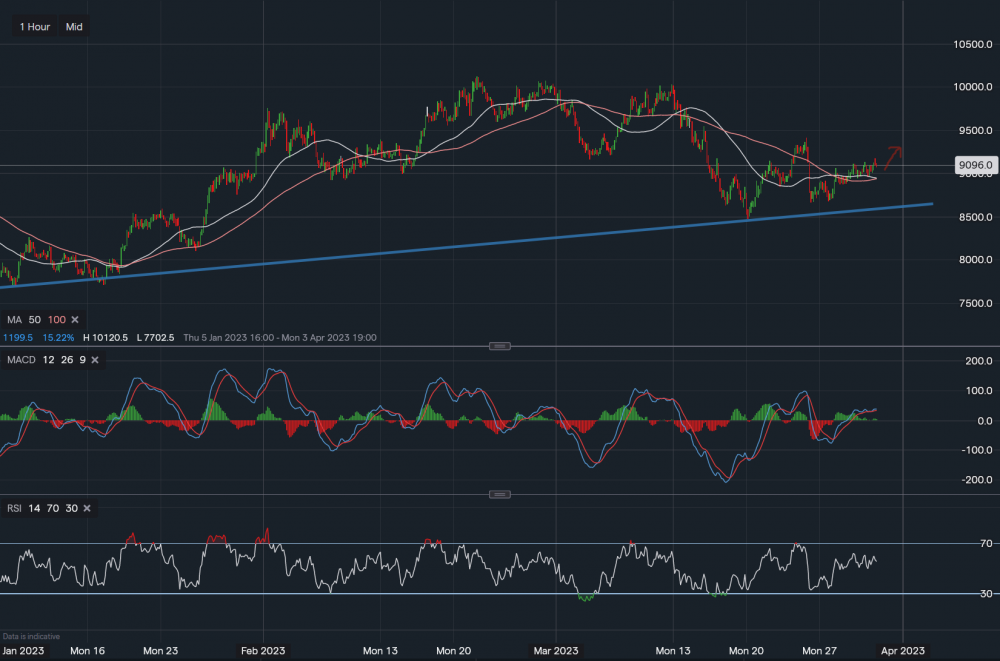
Carbon Emissions - Chart Data IG
Carbon continues to grind higher now moving comfortably above the moving averages on the hourly timeframe. Support for the commodity now sits at $89.40 where the 50 & 100-period moving averages have just crossed over. This is quite a positive sign and could provide further upside over the next few trading sessions. If carbon does break down from its current level $89.40 would act as a major support with further trendline support at $86. Towards the upside, initial targets would be the march swing high at $94. A break above here could easily open the door back towards $100. A move back to its all-time highs would have to be influenced by a stronger gas/oil market and better risk-on attitudes across the broader market though.
 Earnings Calendar
  Economic Calendar
  VAT Calculator
  Tax Free Childcare Calculator
 Percentage Calculator
 Compound Interest Calculator
  Loan Overpayment Calculator
 Mortgage Calculator
 Credit Card Calculator
 Investing
  Economics
 Trading
  Technical Analysis
  Personal Finance
 Calculator


