Visa (NYSE:) Technical Analysis: Earnings in Focus as Bullish Momentum Builds
$364.68
28 Jul 2026, 15:59
Neutral

Join Minipip Academy and access free courses in investing, trading, economics, and more.
Sign Up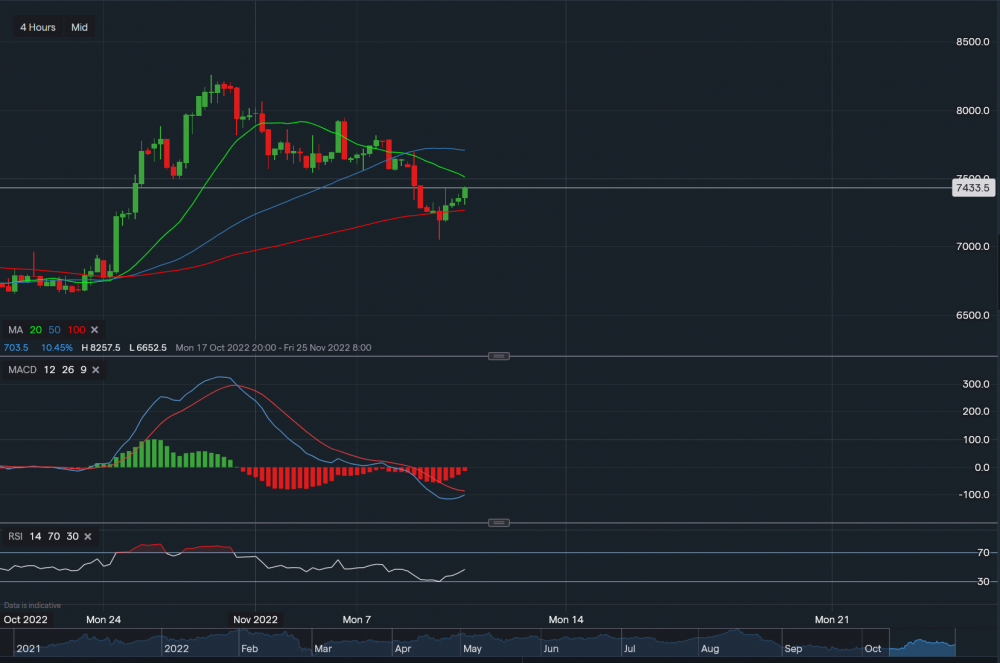
Carbon emissions - Chart & Data from IG
From a technical outlook, the commodity is currently trading at €74.33, with the red 100-day moving average acting as major support at €72.70. A break below this support level could see the price slide towards the €70-€71 price range. Towards the upside, the €74.30 resistance was broken and the major resistance sits at the green 20-day moving average (€75.00). A break above the major resistance could see the price climb towards the 50-moving day average (€77.00). MACD is heading towards the positive stance and RSI just turned neutral as it reads 45.
 Earnings Calendar
  Economic Calendar
  VAT Calculator
  Tax Free Childcare Calculator
 Percentage Calculator
 Compound Interest Calculator
  Loan Overpayment Calculator
 Mortgage Calculator
 Credit Card Calculator
 Investing
  Economics
 Trading
  Technical Analysis
  Personal Finance
 Calculator


