Microsoft (MSFT): AI Leadership Supports Long-Term Growth
$396.94
21 Jul 2026, 22:43
Neutral

Join Minipip Academy and access free courses in investing, trading, economics, and more.
Sign Up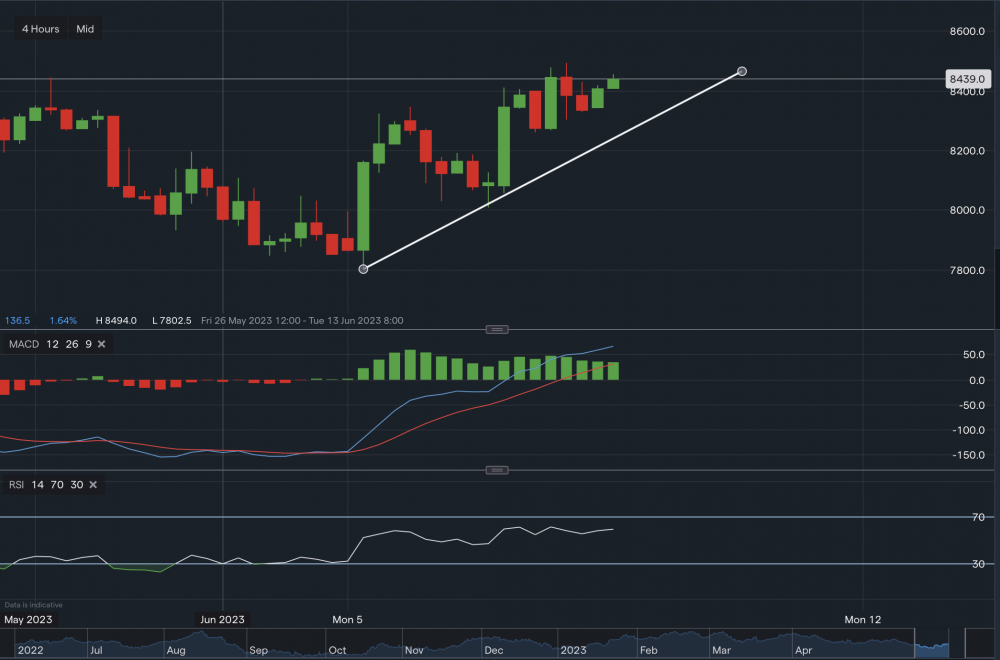
Chart & Data from IG
Carbon remains in a bullish trend, with its price now around €84.39. Looking on the 4 hourly timeframe, we can see that the price is supported along the ascending trendline. Currently, the support below sits at €83.29 (along the trendline). A break below this price level could see the price fall lower towards the next level of support sitting at €82.61. However, this would not necessarily mean that a reversal trend has occured. Only a break below the key support of €80.09 could potentially indicate a reversal trend. Towards the upside, minor resistance sits at €84.45 followed by a tougher resistance point at €84.94. A move above €84.94 may open the path towards €86. Looking at the technical indicators, MACD is positiive and so is the RSI as it reads 59.

Tradable assets:
Min.Deposit:
Max Leverage:
FCA:

Rating:
 Earnings Calendar
  Economic Calendar
  VAT Calculator
  Tax Free Childcare Calculator
 Percentage Calculator
 Compound Interest Calculator
  Loan Overpayment Calculator
 Mortgage Calculator
 Credit Card Calculator
 Investing
  Economics
 Trading
  Technical Analysis
  Personal Finance
 Calculator