Microsoft (MSFT): AI Leadership Supports Long-Term Growth
$396.94
21 Jul 2026, 22:43
Neutral

Join Minipip Academy and access free courses in investing, trading, economics, and more.
Sign Up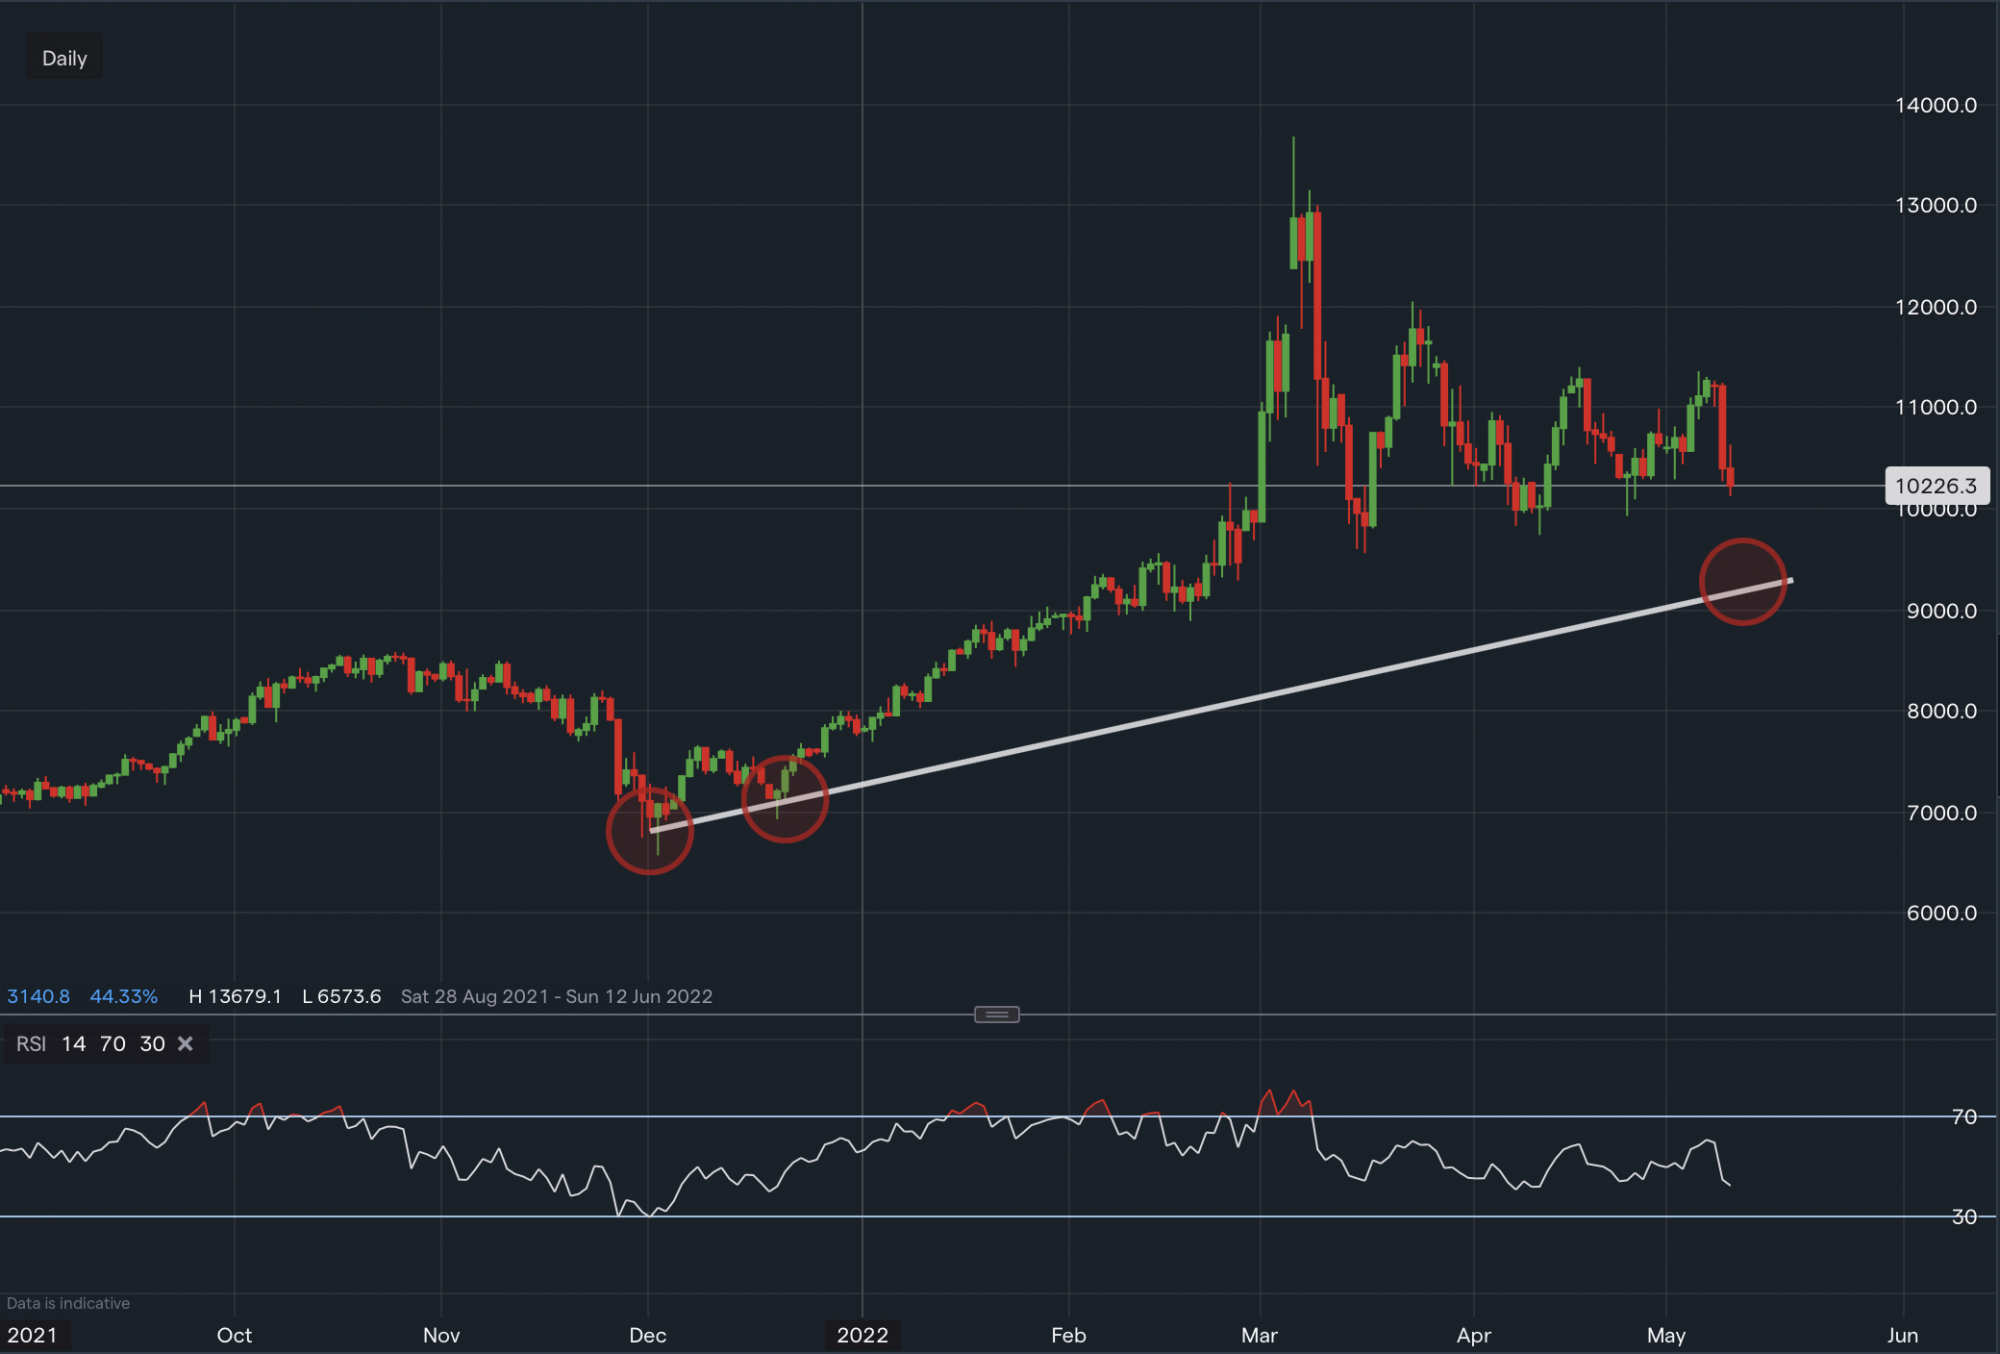
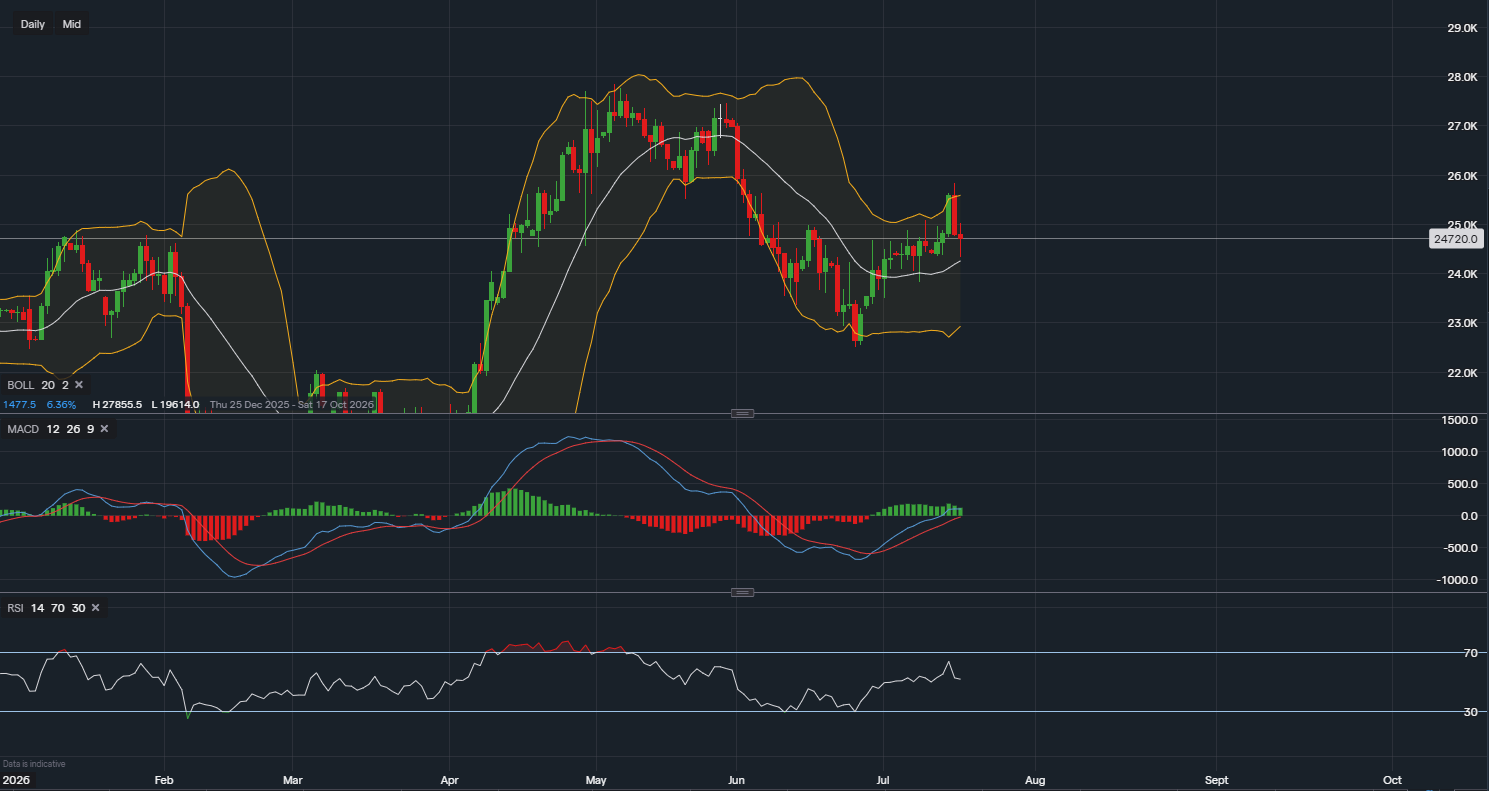
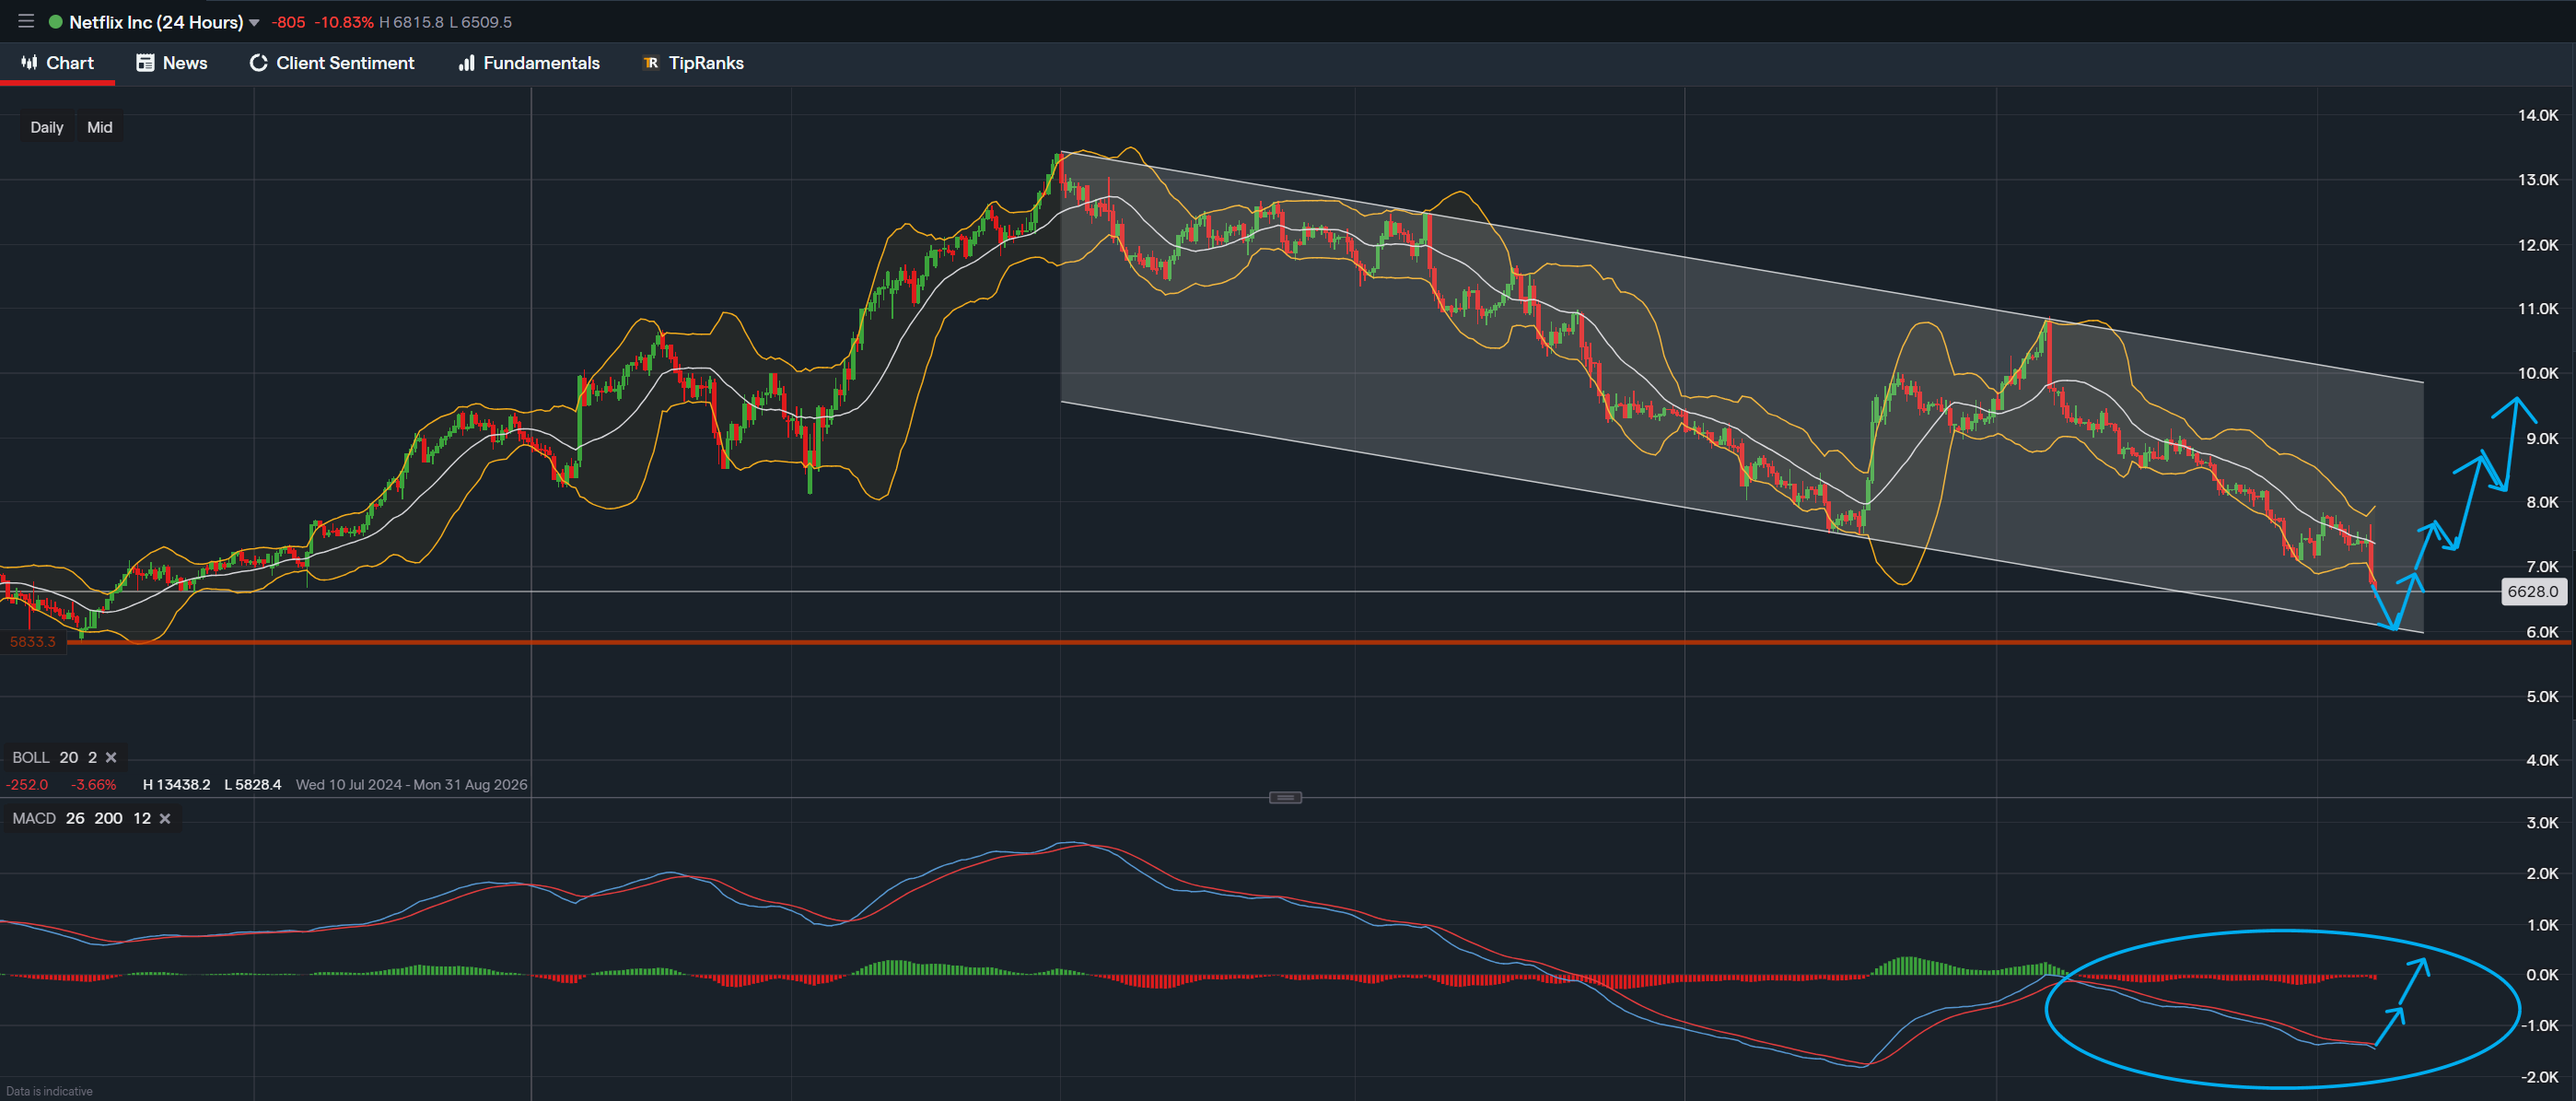
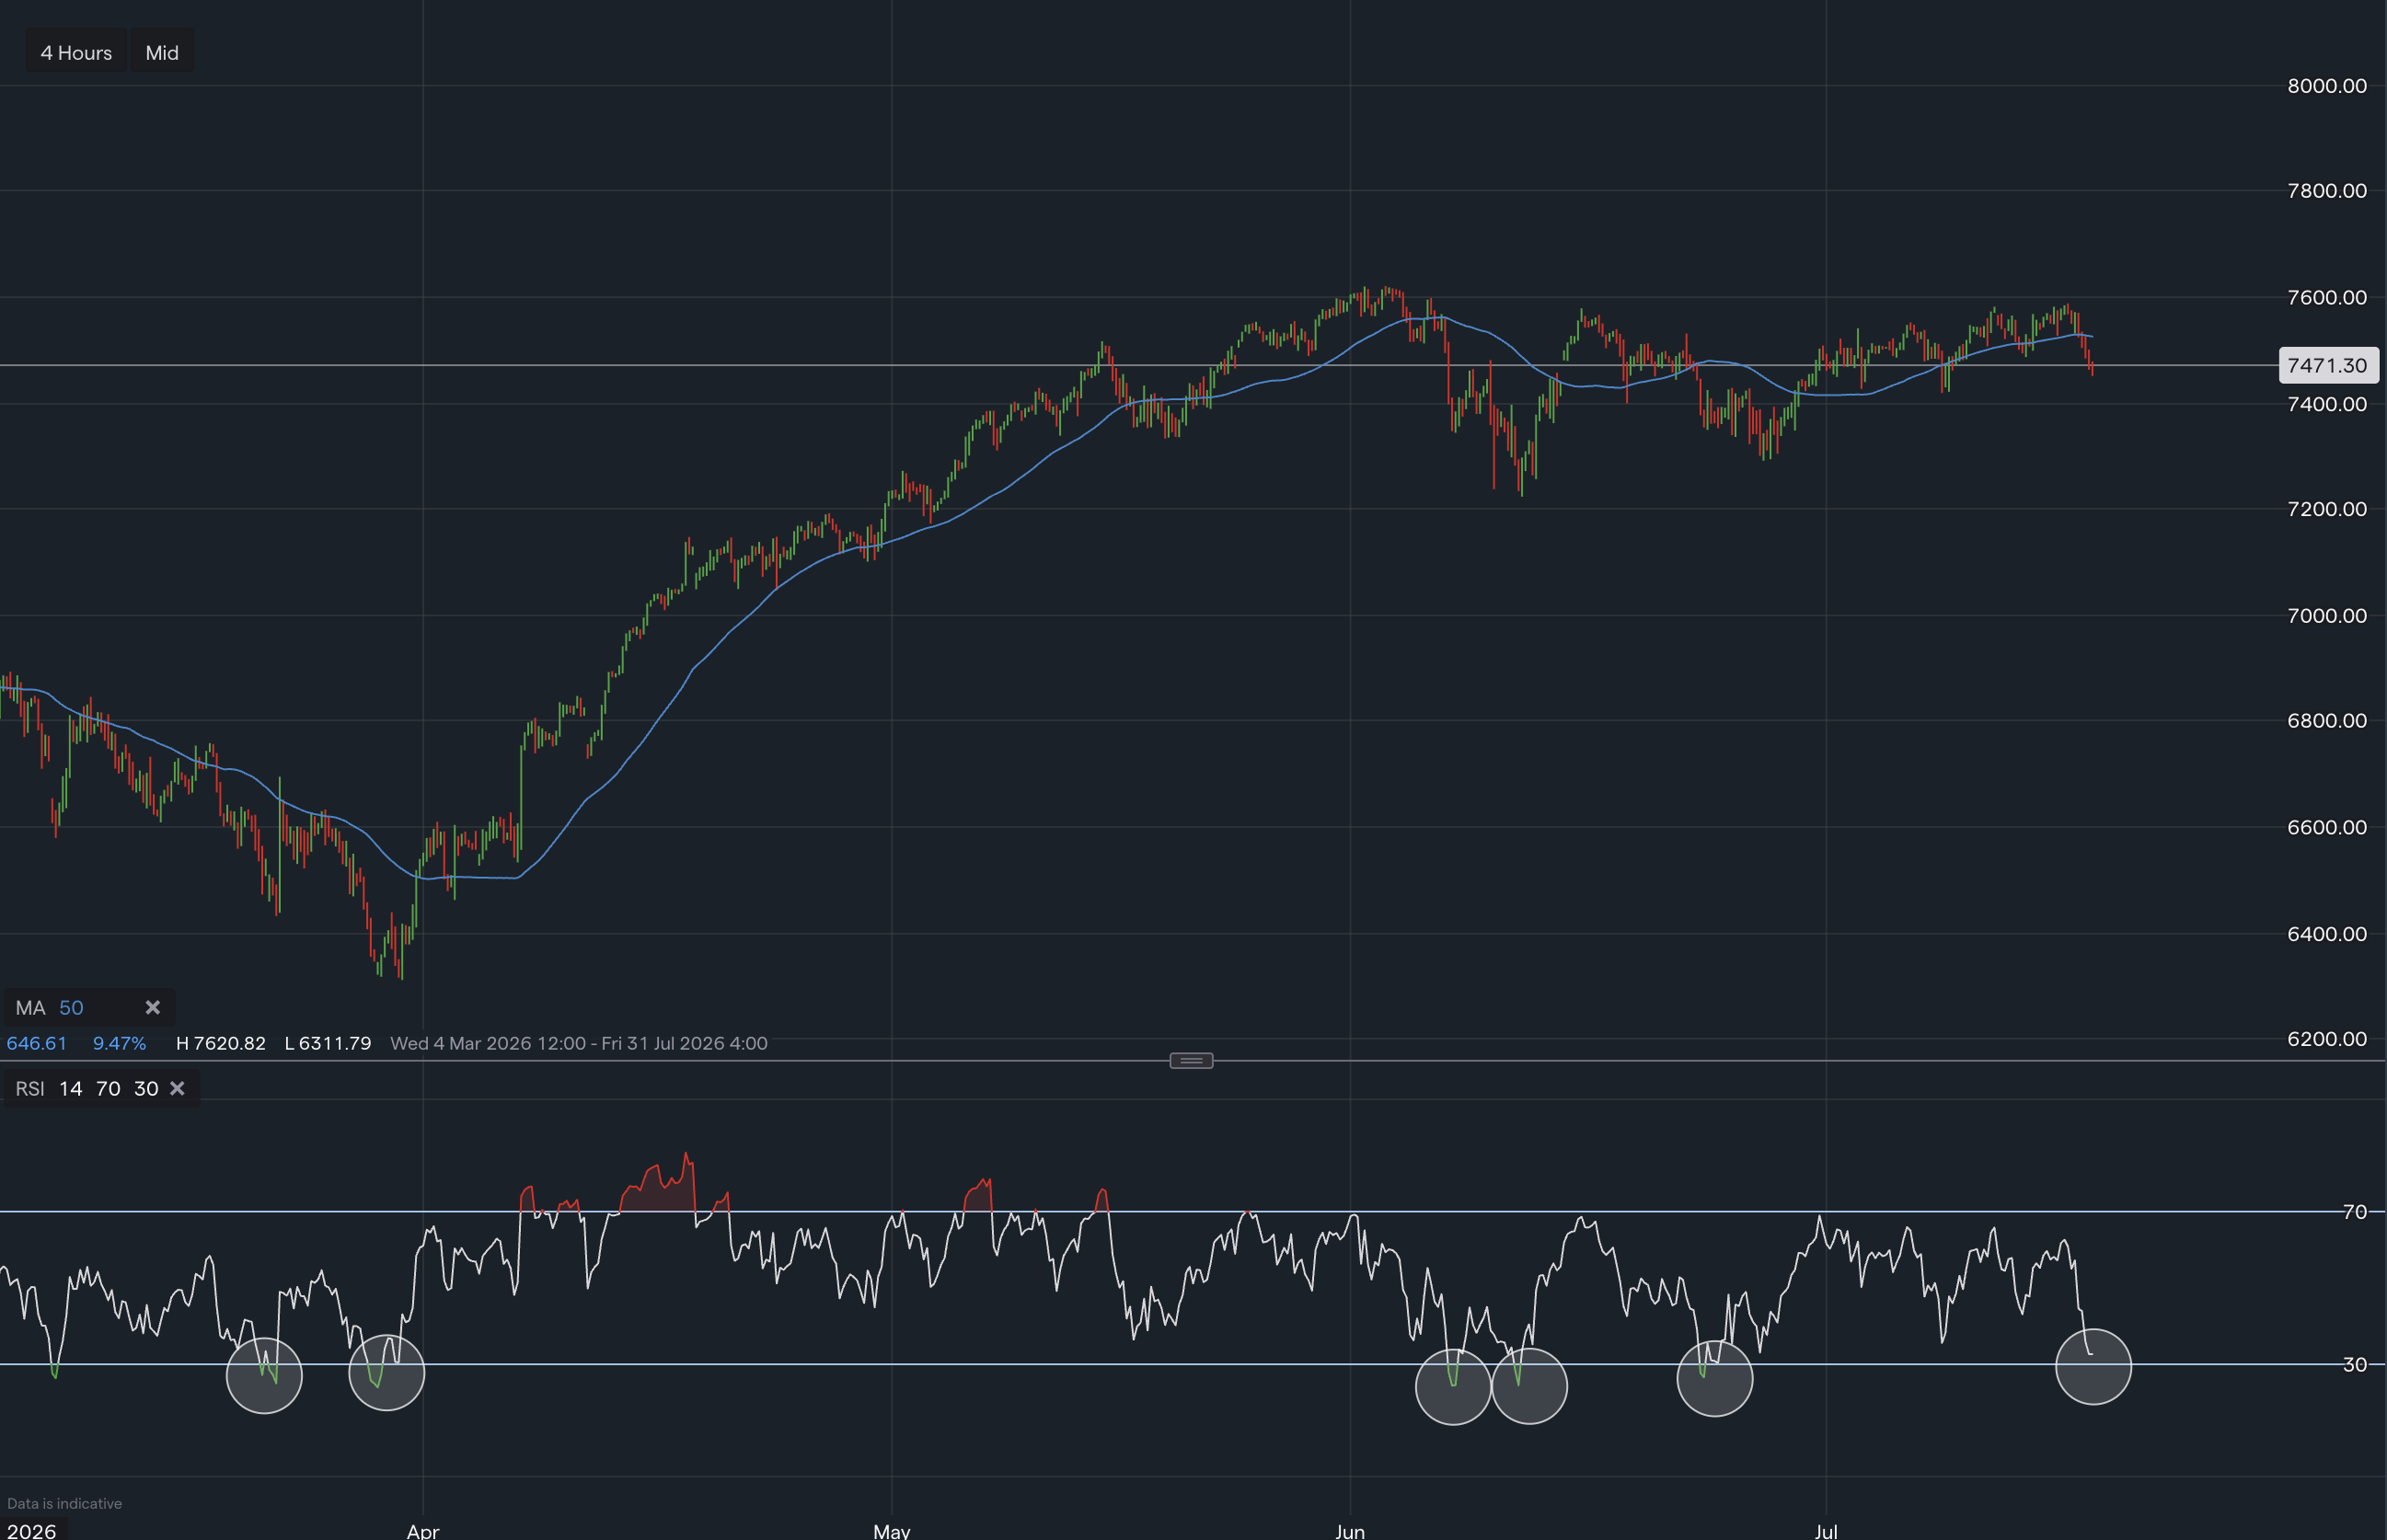
Oil had a significant rally starting Q4 last year peaking at $136.75, mainly due to the Russia Ukraine conflict, before a 30% cool off period over the following 10 days. From a technical aspect The chart shows a lack of control from either the buy or sell side with support at $99.71 and resistance above at $114.29 respectfully, with current RSI at 42 with a resistance on the RSI at 61. The chart is slightly bearish as the lack of strength on the RSI along with no support until the $100 region gives a downside bias. Towards the downside, a break of $98.71/$100.00 level, would allow for a decline towards $95 and then major trendline support at $92 (Highlighted in red). Towards the upside as mentioned we need a bounce at $98,71/$100 support zone with targets towards the swing highs at $114.29. A break above here changes the bias to bullish.
 Earnings Calendar
  Economic Calendar
  VAT Calculator
  Tax Free Childcare Calculator
 Percentage Calculator
 Compound Interest Calculator
  Loan Overpayment Calculator
 Mortgage Calculator
 Credit Card Calculator
 Investing
  Economics
 Trading
  Technical Analysis
  Personal Finance
 Calculator