UnitedHealth Group Analysis: Defensive Healthcare Scale Amid Regulatory and Margin Pressures
$407.34
12 Jun 2026, 17:06
Neutral

Join Minipip Academy and access free courses in investing, trading, economics, and more.
Sign Up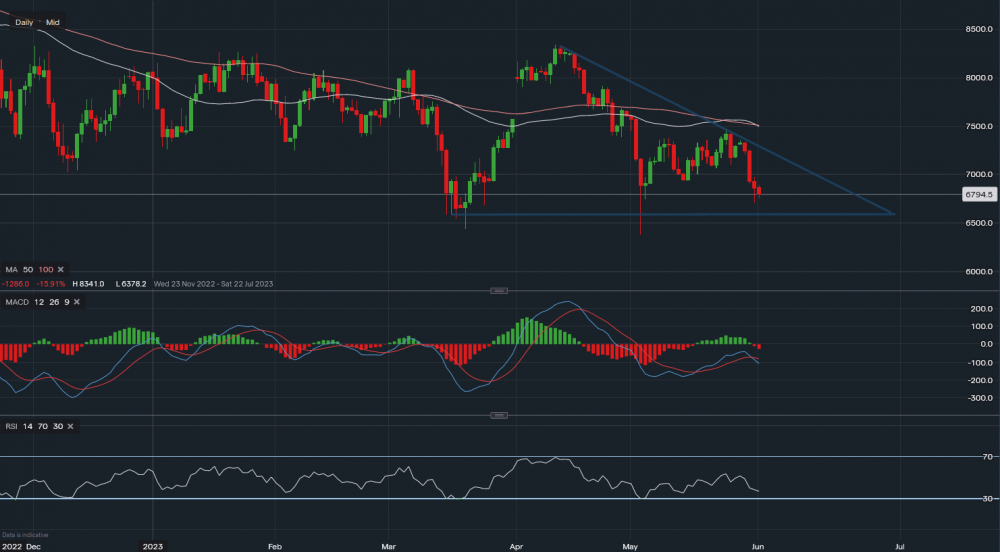
Crude Oil - Chart & Data from IG
Oil prices continue to fall under pressure as markets are pricing in slowdowns across major oil consumers such as China. Oil is currently down 47% from the March 2022 highs. While this is bad for oil-producing companies, this is good for easing inflation and the general public as costs will drop globally.
Looking at the oil chart, there is currently a descending triangle pattern forming with a base at around $65.00 - $65.25. A clear break below here could cause oil the flush way lower towards $60 in the short term. RSI is currently reading 36 with MACD now firmly confirming negative momentum. In March and May of this year, oil prices did fall below 30 which then caused a bounce so another flush lower could be in store before long.
Towards the upside, the triangle resistance pattern suggests resistance at about $70.50-$71.00 with the moving averages also crossing over to form a more bearish outlook.
A break above the triangle pattern would be bullish though and could see oil rally higher towards $75 in the medium term, however a catalyst such as a strong GDP number from a good economy, capped production from OPEC+ or a large drawdown that the markets were not expecting.
Oil prices between $60-$70 is likely a fine price for most of the oil-producing countries, but lower values such as $60 and below could be harmful to profitability.

Tradable assets:
Min.Deposit:
Max Leverage:
FCA:

Rating:
 Earnings Calendar
  Economic Calendar
  VAT Calculator
  Tax Free Childcare Calculator
 Percentage Calculator
 Compound Interest Calculator
  Loan Overpayment Calculator
 Mortgage Calculator
 Credit Card Calculator
 Investing
  Economics
 Trading
  Technical Analysis
  Personal Finance
 Calculator


