Visa (NYSE:) Technical Analysis: Earnings in Focus as Bullish Momentum Builds
$364.68
28 Jul 2026, 15:59
Neutral

Join Minipip Academy and access free courses in investing, trading, economics, and more.
Sign Up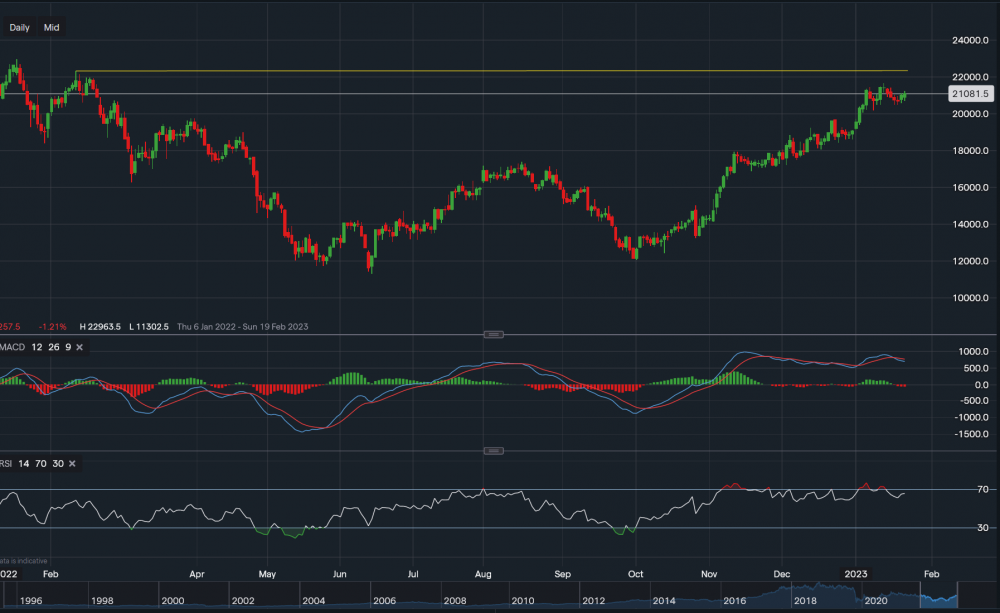
Boeing - Chart & Data from IG
Technicals
Boeing has not had the easiest of periods over the last 2 years with the Covid pandemic hammering its price into the ground, losing around 74% of its total stock value. Additionally, with the ongoing regulations, and opening and closing of borders around the world, its stock has been up and down like a yo-yo. However, it may have found its consolidation levels despite reporting weaker earnings than expected for the past two fiscal years. Looking at the chart on the daily timeframe, we can see a ‘W’ pattern has been formed which suggests there is an opportunity for further upside. Key resistance sits at $223.20, which corresponds with the upper yellow trendline. Boeing is set to report its earnings tomorrow in pre-market and it has proven that it does not need to hit market expectations to creep up. However, a positive report would increase the likelihood of a break above the resistance in the next week or two. On the other hand, the report may sour investor sentiment and see a move in the opposite direction. Consequently, support sits at $204.71 and then at $201.65. A break below $201.65 can lead to a further decline towards the $190-$195 price range. At present, MACD suggests a ‘bearish’ outlook as the signal line has crossed over the MACD line, but RSI suggests ‘bullish’ as it reads 65. So, it is fairly neutral.
 Earnings Calendar
  Economic Calendar
  VAT Calculator
  Tax Free Childcare Calculator
 Percentage Calculator
 Compound Interest Calculator
  Loan Overpayment Calculator
 Mortgage Calculator
 Credit Card Calculator
 Investing
  Economics
 Trading
  Technical Analysis
  Personal Finance
 Calculator


