UnitedHealth Group Analysis: Defensive Healthcare Scale Amid Regulatory and Margin Pressures
$407.34
12 Jun 2026, 17:06
Neutral

Join Minipip Academy and access free courses in investing, trading, economics, and more.
Sign Up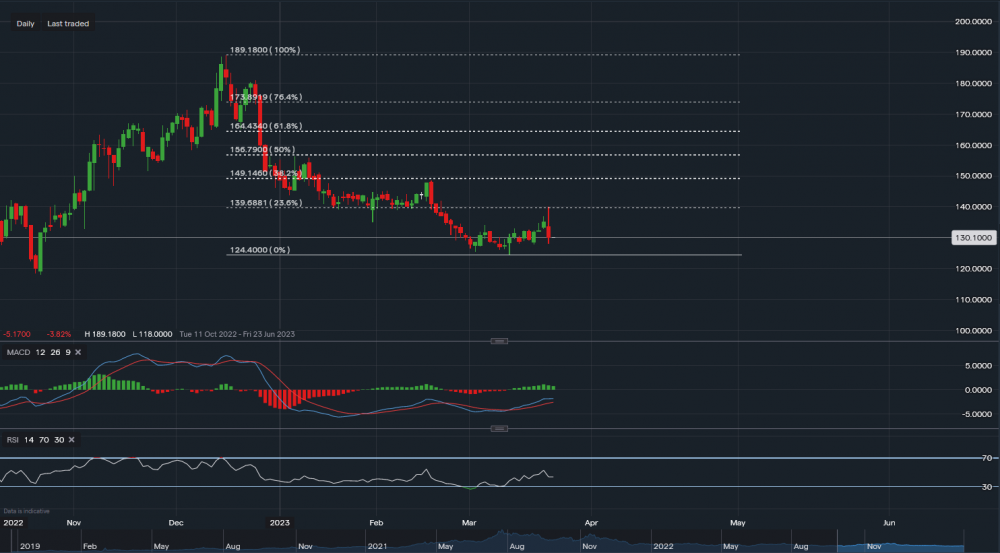
Chart & Data from IG
From a technical viewpoint, BioNTech’s stock is currently trading at around $130.10 a share. Since its peak back in August 2921 to now, it has fallen 72%. The lowering demand for Covid vaccines and heavy selling pressure tumbled the stock over the past 16 months. The company is expected to report earnings on Monday, which may have some influence on the direction of its stock price in the short-mid term. Applying the Fibonacci retracement to the chart, we can see that a support base has been established at $124.40. A break below this base could see the price tumble further towards the $117-$120 price range. On the other hand, a positive report may boost the price higher. Towards the upside, resistance sits at the 23.6% Fib followed by the 38.2% Fib, or respectively, $139.68 and $149.14. The 38.2% Fib level is key for further upside if broken, a break above it could see the price climb as high as $156.79 (50% Fib). Looking at the technical indicators, MACD is fairly positive and RSI is slightly negative as it reads 43.
 Earnings Calendar
  Economic Calendar
  VAT Calculator
  Tax Free Childcare Calculator
 Percentage Calculator
 Compound Interest Calculator
  Loan Overpayment Calculator
 Mortgage Calculator
 Credit Card Calculator
 Investing
  Economics
 Trading
  Technical Analysis
  Personal Finance
 Calculator


