Visa (NYSE:) Technical Analysis: Earnings in Focus as Bullish Momentum Builds
$364.68
28 Jul 2026, 15:59
Neutral

Join Minipip Academy and access free courses in investing, trading, economics, and more.
Sign Up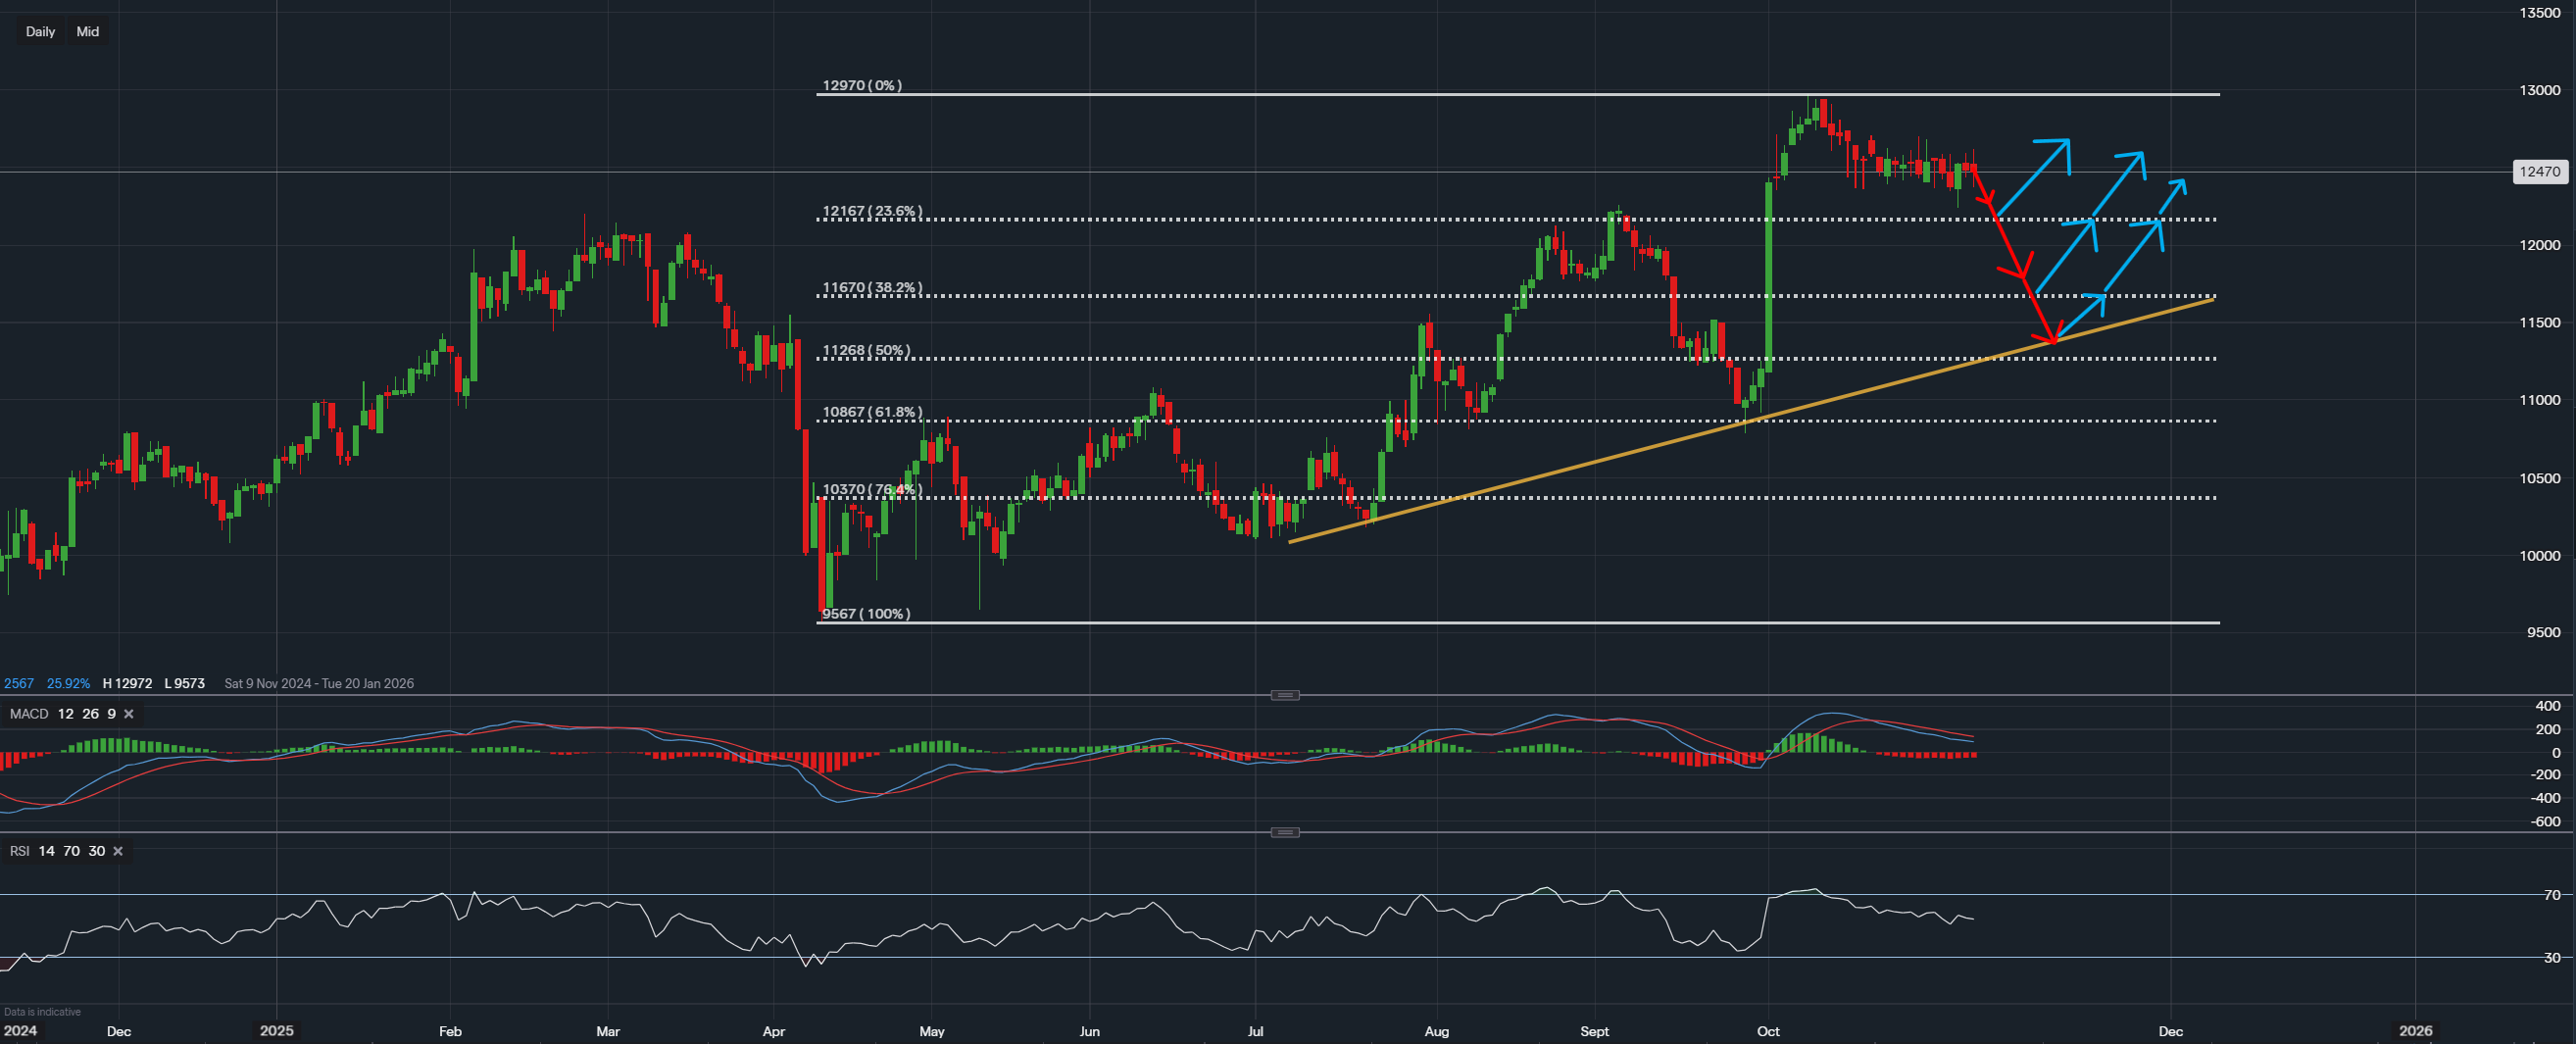
Data from IG - Time frame - Daily
Valuation Overview: Indicators of Underlying Strength
AstraZeneca currently trades with a price-to-earnings (P/E) ratio of 30.77 and a forward P/E ratio of 15.88, placing the company within a valuation range that suggests potential for improved efficiency and growth over the next twelve months. The lower forward P/E implies stronger profitability expectations, reflecting growing confidence in AstraZeneca’s financial outlook as operations continue to expand.
This valuation alignment presents a scenario where the company’s performance trajectory could attract further market attention, particularly if the trend of earnings expansion remains consistent. The balance between the current and forward ratios highlights a position of relative value within the broader pharmaceutical sector.
Earnings Outlook: Consistent Growth and Market Anticipation
AstraZeneca is scheduled to release its third-quarter earnings report on 6 November 2025, which will serve as a key point for assessing the company’s momentum. The previous year’s earnings per share (EPS) came in at $1.04, while consensus forecasts project $1.14, indicating a potential 10% year-on-year improvement.
Beyond quarterly metrics, AstraZeneca’s broader 23.45% annual performance increase reinforces an image of stability and operational strength. These figures suggest the company continues to navigate its growth strategy effectively, maintaining profitability and investor confidence through a combination of product innovation and global market expansion.
Market sentiment also remains constructive. According to TipRanks, analyst coverage, although limited, leans strongly towards positive ratings, with the majority expressing confidence in AstraZeneca’s ability to sustain performance. This combination of consistent earnings and analyst conviction adds weight to its long-term market positioning.
Technical Analysis: Bullish Pattern Supported by a Rising Structure
From a technical standpoint, AstraZeneca’s daily chart maintains a bullish framework, with price action holding near recent highs and demonstrating resilience after short-term pullbacks. The stock continues to trade comfortably above its rising trendline, which has repeatedly acted as dynamic support a sign that buying interest remains active within the current range.
Momentum indicators remain stable. The Relative Strength Index (RSI) is positioned near the 50 level, signaling equilibrium rather than overextension, while the MACD lines remain close to each other with overlapping histogram bars, pointing to short-term consolidation. This suggests the market may be preparing for a potential continuation of the prevailing uptrend.

Data from IG - Timeframe - 3H
Key Levels: Resistance at $12,502.25 and Trendline Support
On the 3-hour timeframe, AstraZeneca (AZN) is testing a significant resistance area near $12,502.25. This price zone represents a pivotal point where either continuation or temporary consolidation could emerge. A sustained break above this level would confirm ongoing market strength, while a pause or retracement could highlight renewed opportunities along the supporting trendline.
The underlying support zone remains intact, reinforcing the idea that the broader trend structure is stable. Even in cases of mild retracement, the current technical landscape continues to indicate a constructive setup within an overall upward trajectory.
Broader Market Perspective: Opportunity Within Stability
AstraZeneca’s current position reflects a blend of fundamental resilience and technical stability, providing a landscape of potential opportunity for market participants observing long-term growth sectors. The combination of improving valuation ratios, projected earnings strength, and consistent technical support offers a picture of a company progressing steadily within a competitive pharmaceutical environment.
As the next earnings release approaches, AstraZeneca’s ability to maintain or extend momentum near the $12,502.25 resistance level could serve as an indicator of continued investor confidence. The balance between solid fundamentals and a technically robust structure positions AstraZeneca as one of the sector’s more stable performers, potentially offering ongoing opportunities within its current growth cycle.
Disclaimer:
This analysis is for informational purposes only and should not be considered financial advice. Investors and traders should conduct their own research and consider individual risk tolerance before making any investment decisions.

Tradable assets:
Min.Deposit:
Max Leverage:
FCA:

Rating:
 Earnings Calendar
  Economic Calendar
  VAT Calculator
  Tax Free Childcare Calculator
 Percentage Calculator
 Compound Interest Calculator
  Loan Overpayment Calculator
 Mortgage Calculator
 Credit Card Calculator
 Investing
  Economics
 Trading
  Technical Analysis
  Personal Finance
 Calculator


