Visa (NYSE:) Technical Analysis: Earnings in Focus as Bullish Momentum Builds
$364.68
28 Jul 2026, 15:59
Neutral

Join Minipip Academy and access free courses in investing, trading, economics, and more.
Sign Up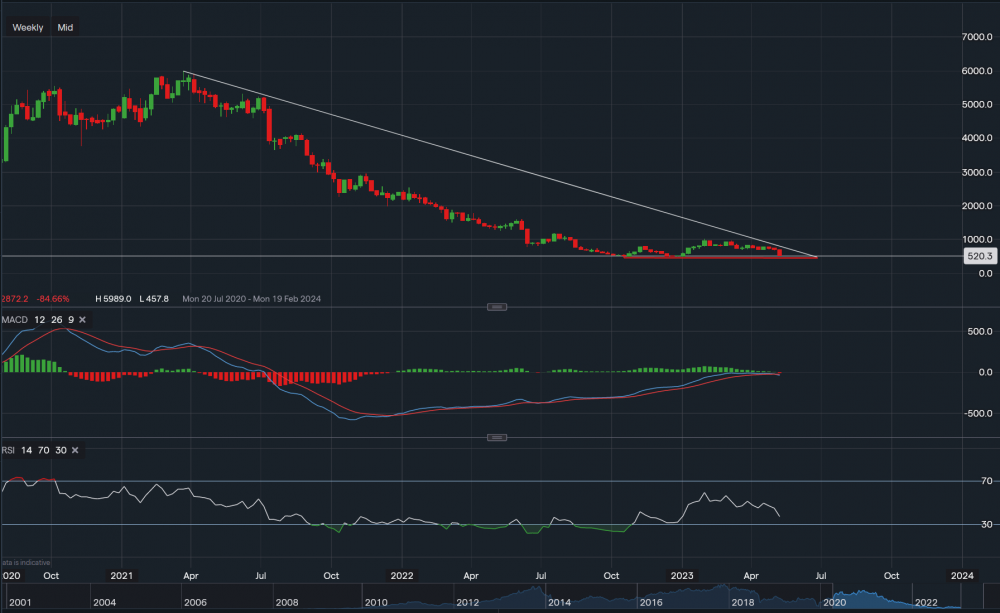
Chart & Data from IG
ASOS PLC reported a loss in the first half but claimed it is still on track to meet its goals for the entire year. In comparison to a profit of £14.8 million during the same time the previous year, the online fashion store saw an adjusted loss before tax of £87.4 million in the six months ending on February 28, 2023. Due to the difficult economic environment and capital allocation towards profitability, revenues decreased to £1.8 billion from £2.0 billion, and net debt increased to £431.7 million from £62.6 million.
Looking at its stock price, shares are currently down 19% trading at around 520p a share. We can see that the price is now approaching the key support level of 457p, which rests along the red trendline. A break and close below the trendline could see the price slide much further, even as low as 350p a share in the mid-long term. At the moment there are no signs of any upside but if consolidation occurs, then resistance now sits at 653p, which is located along the descending trendline. Only a break above the descending trendline could see further upside, with the target then in the range of 700-800p. Technical indicators are now suggesting bearish movement, with the MACD turning negative on the weekly timeframe and the RSI reading 37.

Tradable assets:
Min.Deposit:
Max Leverage:
FCA:

Rating:
 Earnings Calendar
  Economic Calendar
  VAT Calculator
  Tax Free Childcare Calculator
 Percentage Calculator
 Compound Interest Calculator
  Loan Overpayment Calculator
 Mortgage Calculator
 Credit Card Calculator
 Investing
  Economics
 Trading
  Technical Analysis
  Personal Finance
 Calculator


