UnitedHealth Group Analysis: Defensive Healthcare Scale Amid Regulatory and Margin Pressures
$407.34
12 Jun 2026, 17:06
Neutral

Join Minipip Academy and access free courses in investing, trading, economics, and more.
Sign Up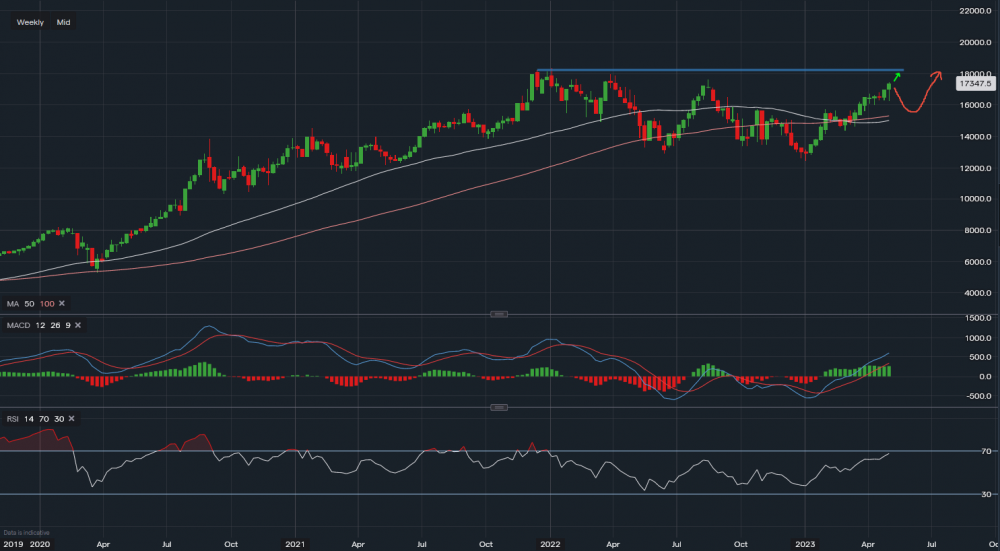
Chart & Data from IG
Apple shares accelerated higher last week after a strong Q1 earnings. Apple saw iPhone revenue top $51.3bn with an estimate of $48.9bn. As a result of this, Apple's adjusted EPS was $1.52 per share vs $1.43. MAC sales & other services faltered though, but it didn't stop a strong 5.5% rally on Friday. This as a result pushes all indices higher and there is reason for this to continue into this week as well as the economic and earnings calendar becomes lighter but there are some important events too.
Looking at the Apple chart, the stock is clearly in an uptrend with MACD strongly positive and RSI reading 67.5 on the weekly timeframe which could indicate further upside in the short term. Tough resistance sits at $183.45 which is the January 2022 all-time-highs. A break above here could take Apple looking for $200 this year. If Apple fails to break out there is plenty of support below, namely at $163.75 weekly lows, followed by the 50SMA at $159.76 and then 100SMA at $150.

(Apple chart on the daily timeframe with further support below)

Tradable assets:
Min.Deposit:
Max Leverage:
FCA:

Rating:
 Earnings Calendar
  Economic Calendar
  VAT Calculator
  Tax Free Childcare Calculator
 Percentage Calculator
 Compound Interest Calculator
  Loan Overpayment Calculator
 Mortgage Calculator
 Credit Card Calculator
 Investing
  Economics
 Trading
  Technical Analysis
  Personal Finance
 Calculator


