Visa (NYSE:) Technical Analysis: Earnings in Focus as Bullish Momentum Builds
$364.68
28 Jul 2026, 15:59
Neutral

Join Minipip Academy and access free courses in investing, trading, economics, and more.
Sign Up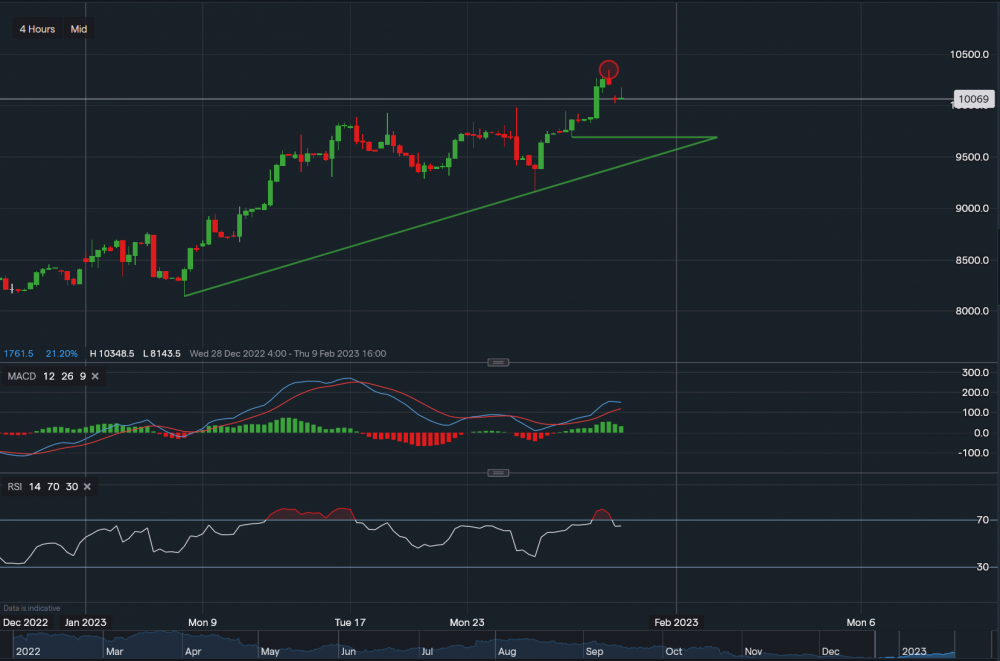
Amazon - Chart & Data from IG
Financials
When comparing the fiscal year that ends on December 31st, 2021, to the prior year, 2020, Amazon’s revenue increased by $83bn and gross profit increased by $44bn. In 2021, net income grew 57% to $33bn billion after tax and all operating expenses. Additionally, EBITDA increased by $11bn, while EPS jumped from $2.09 to $3.24. Moreover, looking at Amazon’s balance sheet, total liabilities rose by $54bn, while total assets increased by a whopping $99bn, offsetting the increase in business liabilities and creating a healthy financial balance within the business. Finally, its cash-on-hand value rose from $84bn to $96bn billion YoY. As a result of the significant rise in assets compared to liabilities, the total equity of the company hiked 48% in 2021.
Technicals
From a technical aspect, Amazon’s stock is currently trading at around $100.69 a share. Taking a look at the chart on the 4-Hour interval, we can see that resistance sits above at $103.48 as highlighted by the red oval. A break above this resistance point could see the price climb towards the $105-$106 range. On the other hand, Amazon is expected to report its earnings on Thursday, 2nd of February. It is expected to report earnings of $0.17 on revenue of $145bn, and a loss in earnings might see the value of its stock decline. Therefore, at present, minor support sits at $110.23 then at $98.27 then at $96.92 (matching with the horizontal trendline). A break below this trendline may see the price decline as far as $91.53, which is where the next major support level rests. Taking a look at the technical indicators, MACD is currently positive and so is RSI as it reads 65.
 Earnings Calendar
  Economic Calendar
  VAT Calculator
  Tax Free Childcare Calculator
 Percentage Calculator
 Compound Interest Calculator
  Loan Overpayment Calculator
 Mortgage Calculator
 Credit Card Calculator
 Investing
  Economics
 Trading
  Technical Analysis
  Personal Finance
 Calculator


