UnitedHealth Group Analysis: Defensive Healthcare Scale Amid Regulatory and Margin Pressures
$407.34
12 Jun 2026, 17:06
Neutral

Join Minipip Academy and access free courses in investing, trading, economics, and more.
Sign Up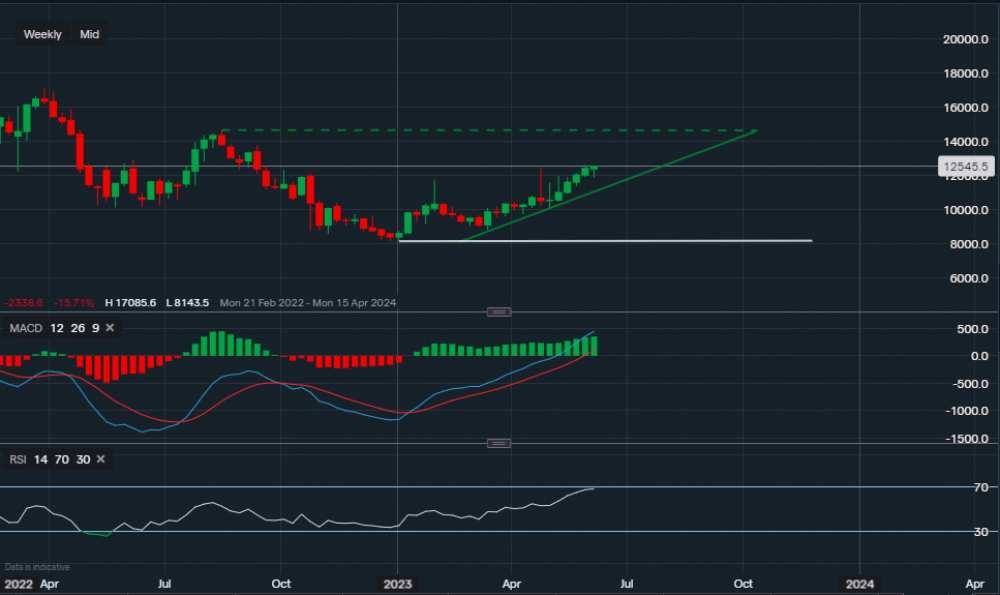
Chart & Data from IG
Amazon is trading at around $125.45 a share. After falling almost 57% last year, it has shown great signs of recovery. Very similar to that of Alphabet. Again, the base is highlighted along the white trendline as also shown with Alphabet in our previous post. In this case, the base sits at $81.43 and only a dip below $97.55 could suggest further downside. As the bias remains bullish, looking towards the upside, minor resistance sits at $126.38 and then at $128.97. A break above $128.97 could see the price rise higher towards $137.78, and then even test the major resistance at $146.56 (upper dotted trendline). Although, this is more likely in the longer term. Similar to Alphabet, both the MACD and RSI are positive with the RSI reading 68.

Tradable assets:
Min.Deposit:
Max Leverage:
FCA:

Rating:
 Earnings Calendar
  Economic Calendar
  VAT Calculator
  Tax Free Childcare Calculator
 Percentage Calculator
 Compound Interest Calculator
  Loan Overpayment Calculator
 Mortgage Calculator
 Credit Card Calculator
 Investing
  Economics
 Trading
  Technical Analysis
  Personal Finance
 Calculator


