UnitedHealth Group Analysis: Defensive Healthcare Scale Amid Regulatory and Margin Pressures
$407.34
12 Jun 2026, 17:06
Neutral

Join Minipip Academy and access free courses in investing, trading, economics, and more.
Sign Up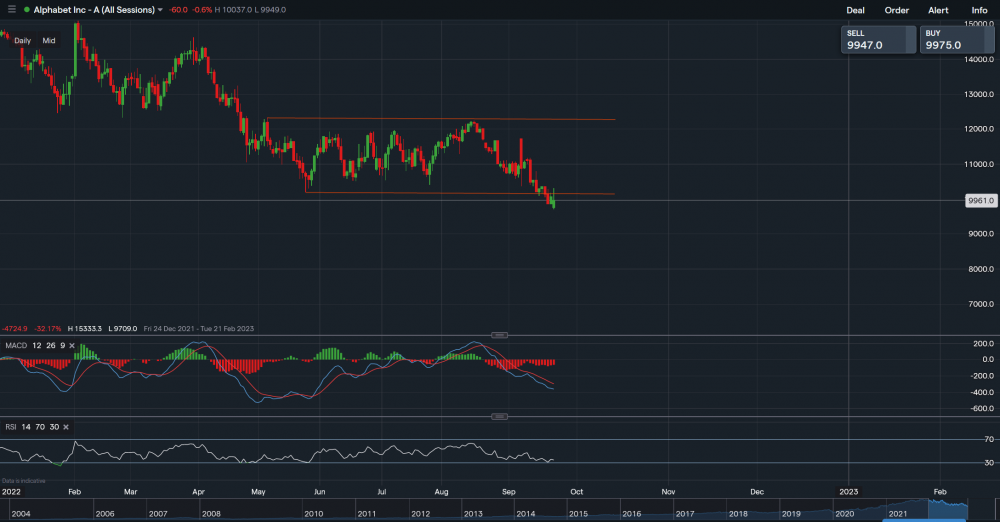
Google currently trading at $99.71 dollars as share price pierces through the support. From a technical aspect, the major support sits at $101.88 which was broken in the recent days (lower orange trendline). The stock was showing signs of stabilisation but discussions on network fees and Ofcom investigating regulations, has had its negative impacts. With the share price now trading on the lows of Feb 2021, an established support base is necessary otherwise it could start sliding towards the lows of the peak pandemic era (low-mid $70s). If network fees aren’t implemented and investigations mellow out, towards the upside the resistance sits at $101.88 which was initially the support (lower orange trendline). A break above this resistance level would see further resistance at $107.97, only if the second resistance was defeated, the stock would see stability again. Looking at the technical indicators, MACD is negative heading in a downwards trend with RSI reading 34, overall suggesting a bearish outlook

Tradable assets:
Min.Deposit:
Max Leverage:
FCA:

Rating:
 Earnings Calendar
  Economic Calendar
  VAT Calculator
  Tax Free Childcare Calculator
 Percentage Calculator
 Compound Interest Calculator
  Loan Overpayment Calculator
 Mortgage Calculator
 Credit Card Calculator
 Investing
  Economics
 Trading
  Technical Analysis
  Personal Finance
 Calculator


