Visa (NYSE:) Technical Analysis: Earnings in Focus as Bullish Momentum Builds
$364.68
28 Jul 2026, 15:59
Neutral

Join Minipip Academy and access free courses in investing, trading, economics, and more.
Sign Up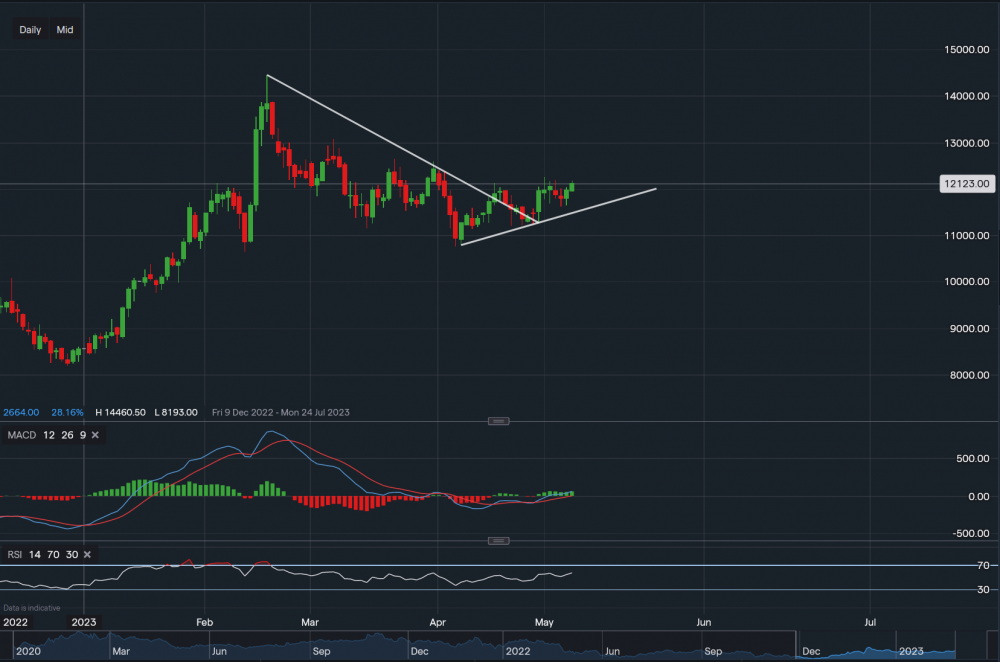
Chart & Data from IG
Analysing Airbnb as it now may seem that the price has re-entered the bullish trend from the start of the year. Currently trading at around $121.23 a share, the price broke above the descending trendline suggesting there could be further upside. At present, resistance is sitting at $122.63 then at $125.95. A break above $125.95 could see a hike towards $130 and maybe even as high as $135-$140. Although that price target is more likely in the midterm. The support below sits tightly at $116.18 then at $112.05 (along the ascending trendline). A break below the trendline and $112.05 may see the price drop lower towards the major support at $107.70. Looking at the indicators, MACD is slightly positive and so is RSI as it reads 58. Airbnb is scheduled to report earnings tomorrow, it's expected to report earnings of $0.20 on revenue of $1.79 billion. Therefore, investors should be cautious when trading and investing as the release of earnings will have an influence on the price of its stock.

Tradable assets:
Min.Deposit:
Max Leverage:
FCA:

Rating:
 Earnings Calendar
  Economic Calendar
  VAT Calculator
  Tax Free Childcare Calculator
 Percentage Calculator
 Compound Interest Calculator
  Loan Overpayment Calculator
 Mortgage Calculator
 Credit Card Calculator
 Investing
  Economics
 Trading
  Technical Analysis
  Personal Finance
 Calculator


