Microsoft (MSFT): AI Leadership Supports Long-Term Growth
$396.94
21 Jul 2026, 22:43
Neutral

Join Minipip Academy and access free courses in investing, trading, economics, and more.
Sign Up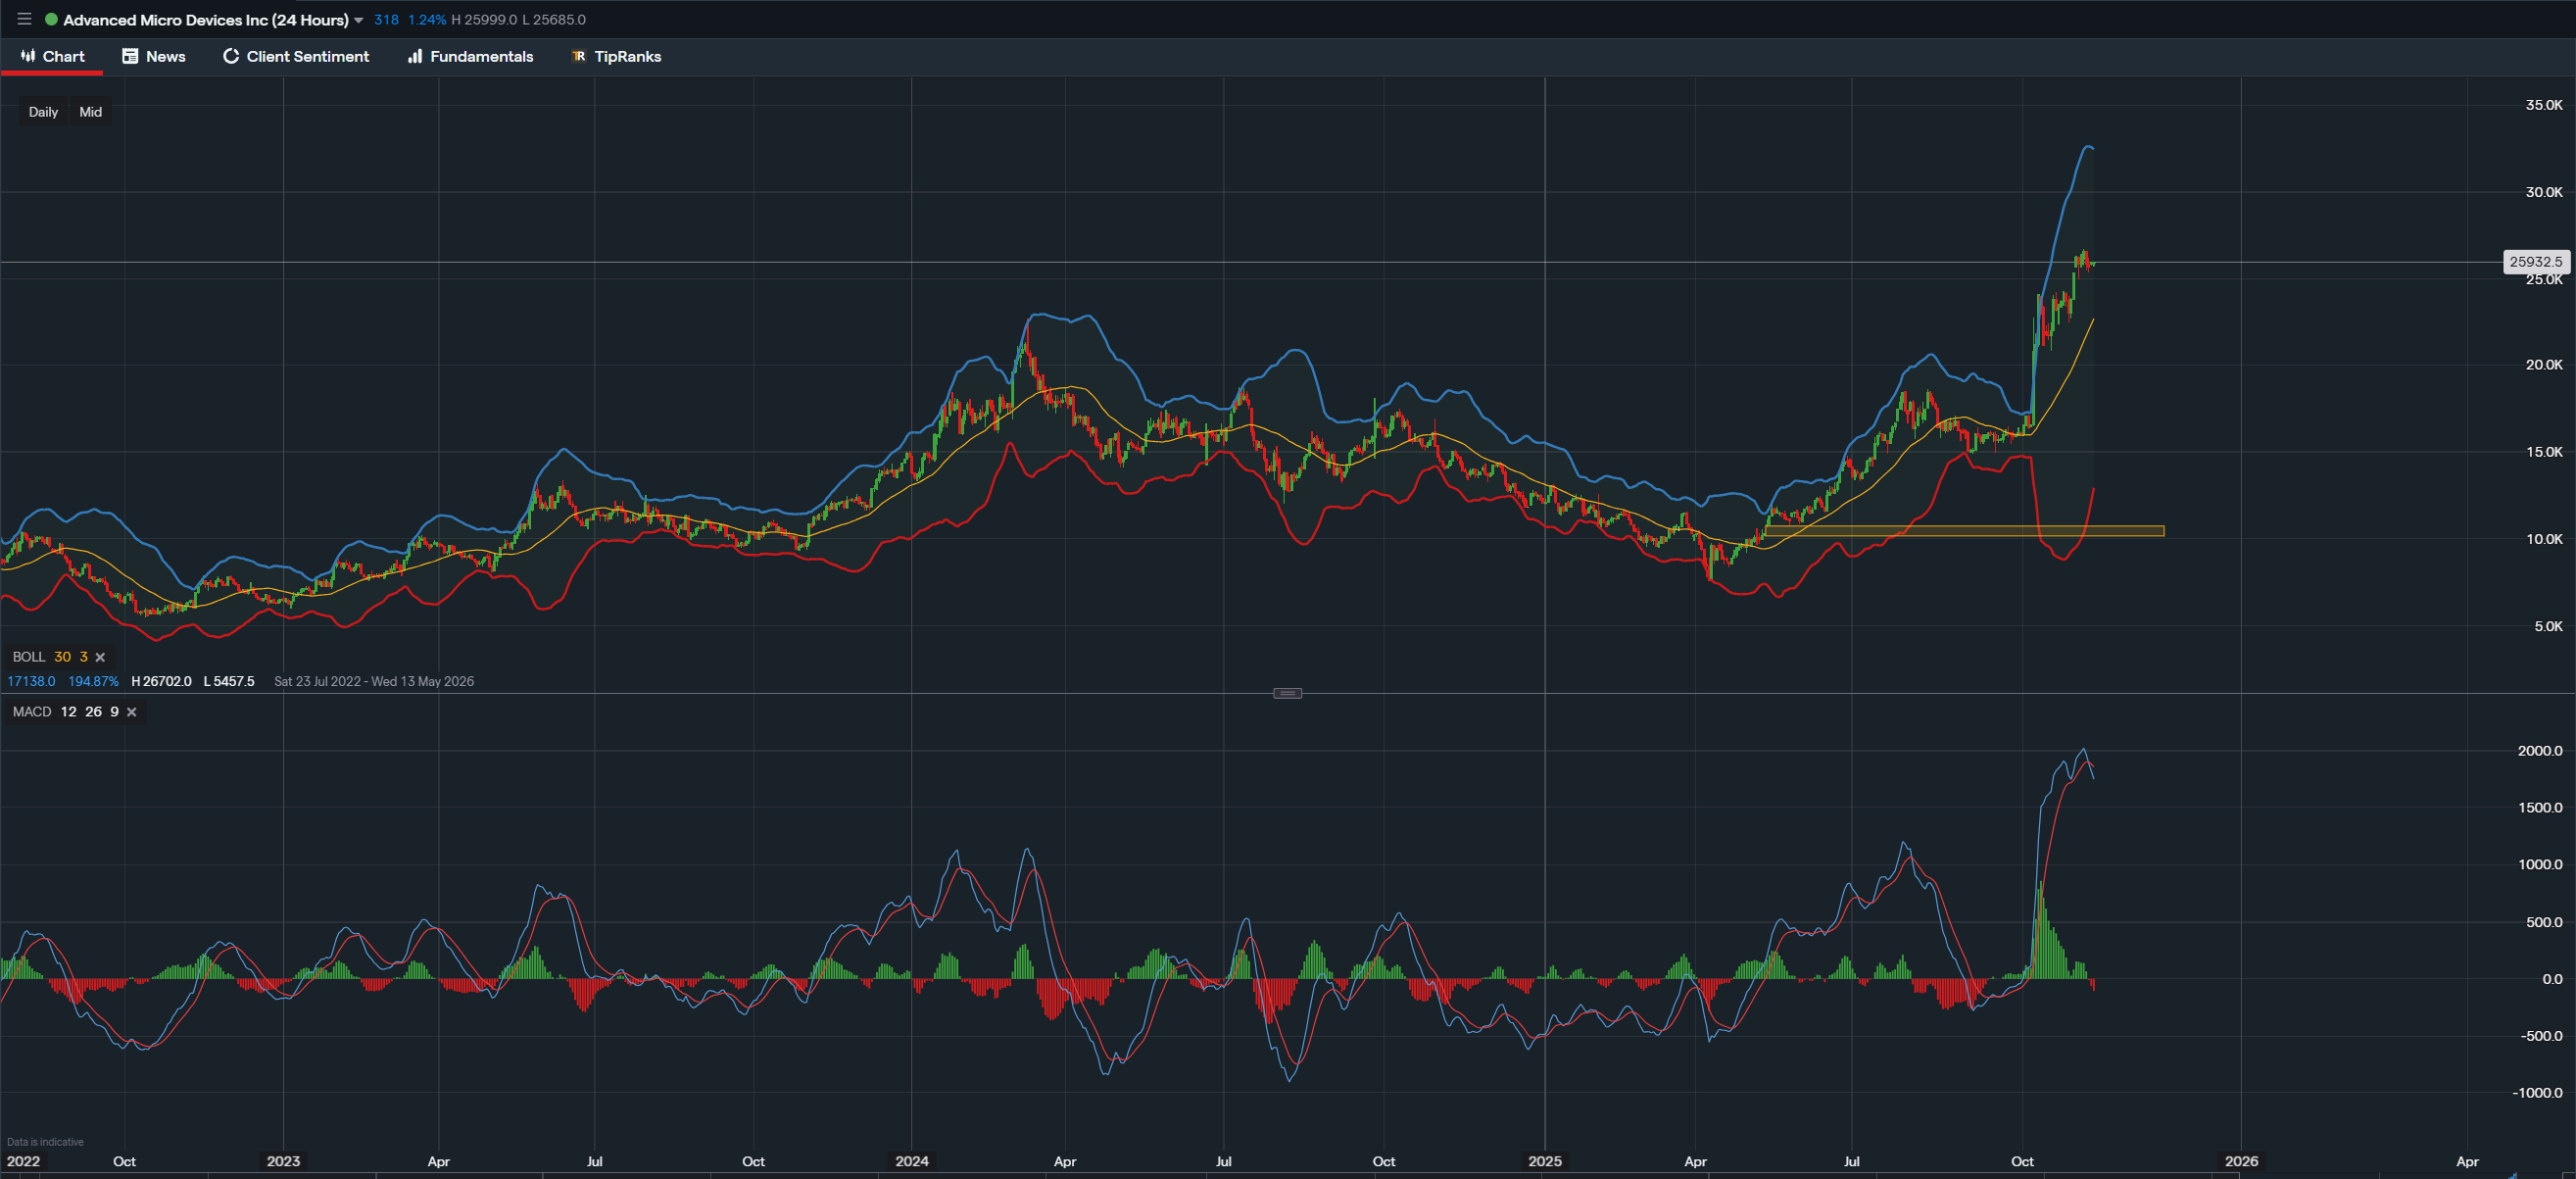
Data from IG - Timeframe - Daily
Summary
AMD presents a compelling investment case with a strong foundation in both fundamental and technical indicators. The company's robust earnings outlook and significant stock price appreciation underscore its potential for continued growth. While short-term technical indicators suggest a possible pullback, the overall sentiment remains bullish. TipRanks data highlights a favorable analyst consensus, predominantly driven by "Buy" recommendations. This positive outlook, combined with price forecasts ranging from $160 to $310, suggests an attractive entry point for investors seeking exposure to the semiconductor industry.
Fundamental Overview
AMD's financial health is reflected in its current Price-to-Earnings (P/E) ratio of 147.42. While seemingly high, the forward P/E ratio of 40.75 signals anticipated profitability and substantial earnings growth over the next twelve months, indicating that the current valuation is expected to normalize as earnings increase. The company's stock has demonstrated significant investor confidence, evidenced by an 82% year-over-year price increase. This appreciation reflects the market's recognition of AMD's strategic positioning in key growth areas such as data centers, gaming, and embedded systems.
Earnings Outlook
The market is keenly anticipating AMD's 3rd Quarter earnings release, scheduled for November 4th, 2025. Consensus Earnings Per Share (EPS) forecasts predict a 28% increase, projecting an EPS of $0.97 compared to the previous year's $0.76. This projected growth underscores AMD's ability to capitalize on market opportunities and execute its strategic initiatives effectively. The anticipated earnings growth is a key driver of investor sentiment and supports the overall bullish outlook for the stock.

Data from IG - Timeframe - 4H
Technical Analysis
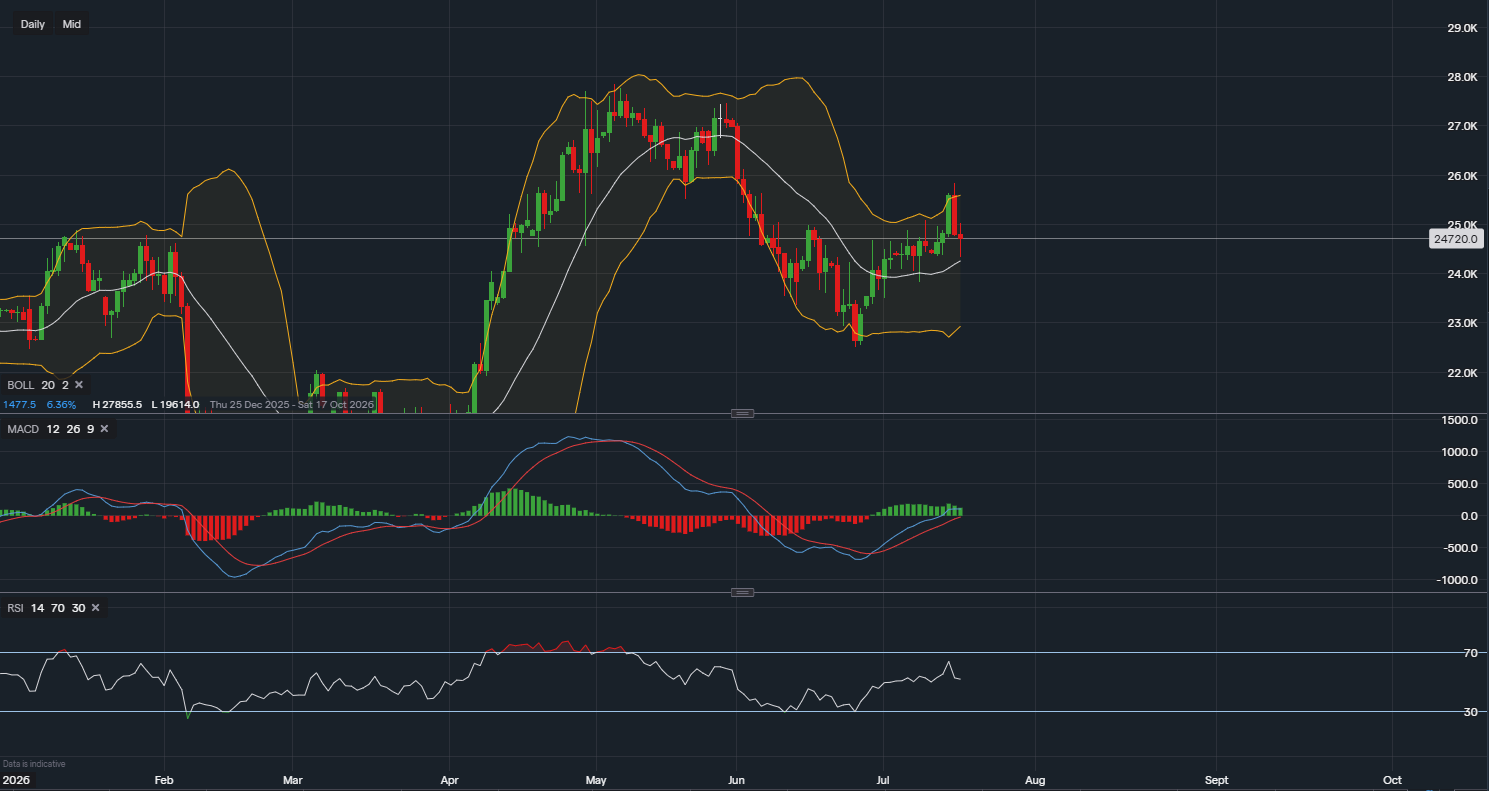
An examination of the Day chart reveals a recent surge above the upper Bollinger Band, indicating strong upward momentum and a potential overbought condition. This bullish signal was initially corroborated by the Moving Average Convergence Divergence (MACD) indicator, where the MACD line crossed above the signal line, and the histogram bars supported the upward trend. However, a recent weakening in the MACD - Moving Average Convergence Divergence (MACD) histogram suggests a possible short-term pullback, creating a divergence between price action and MACD momentum that warrants careful consideration. Consequently, a retracement around the $200 zone is possible.
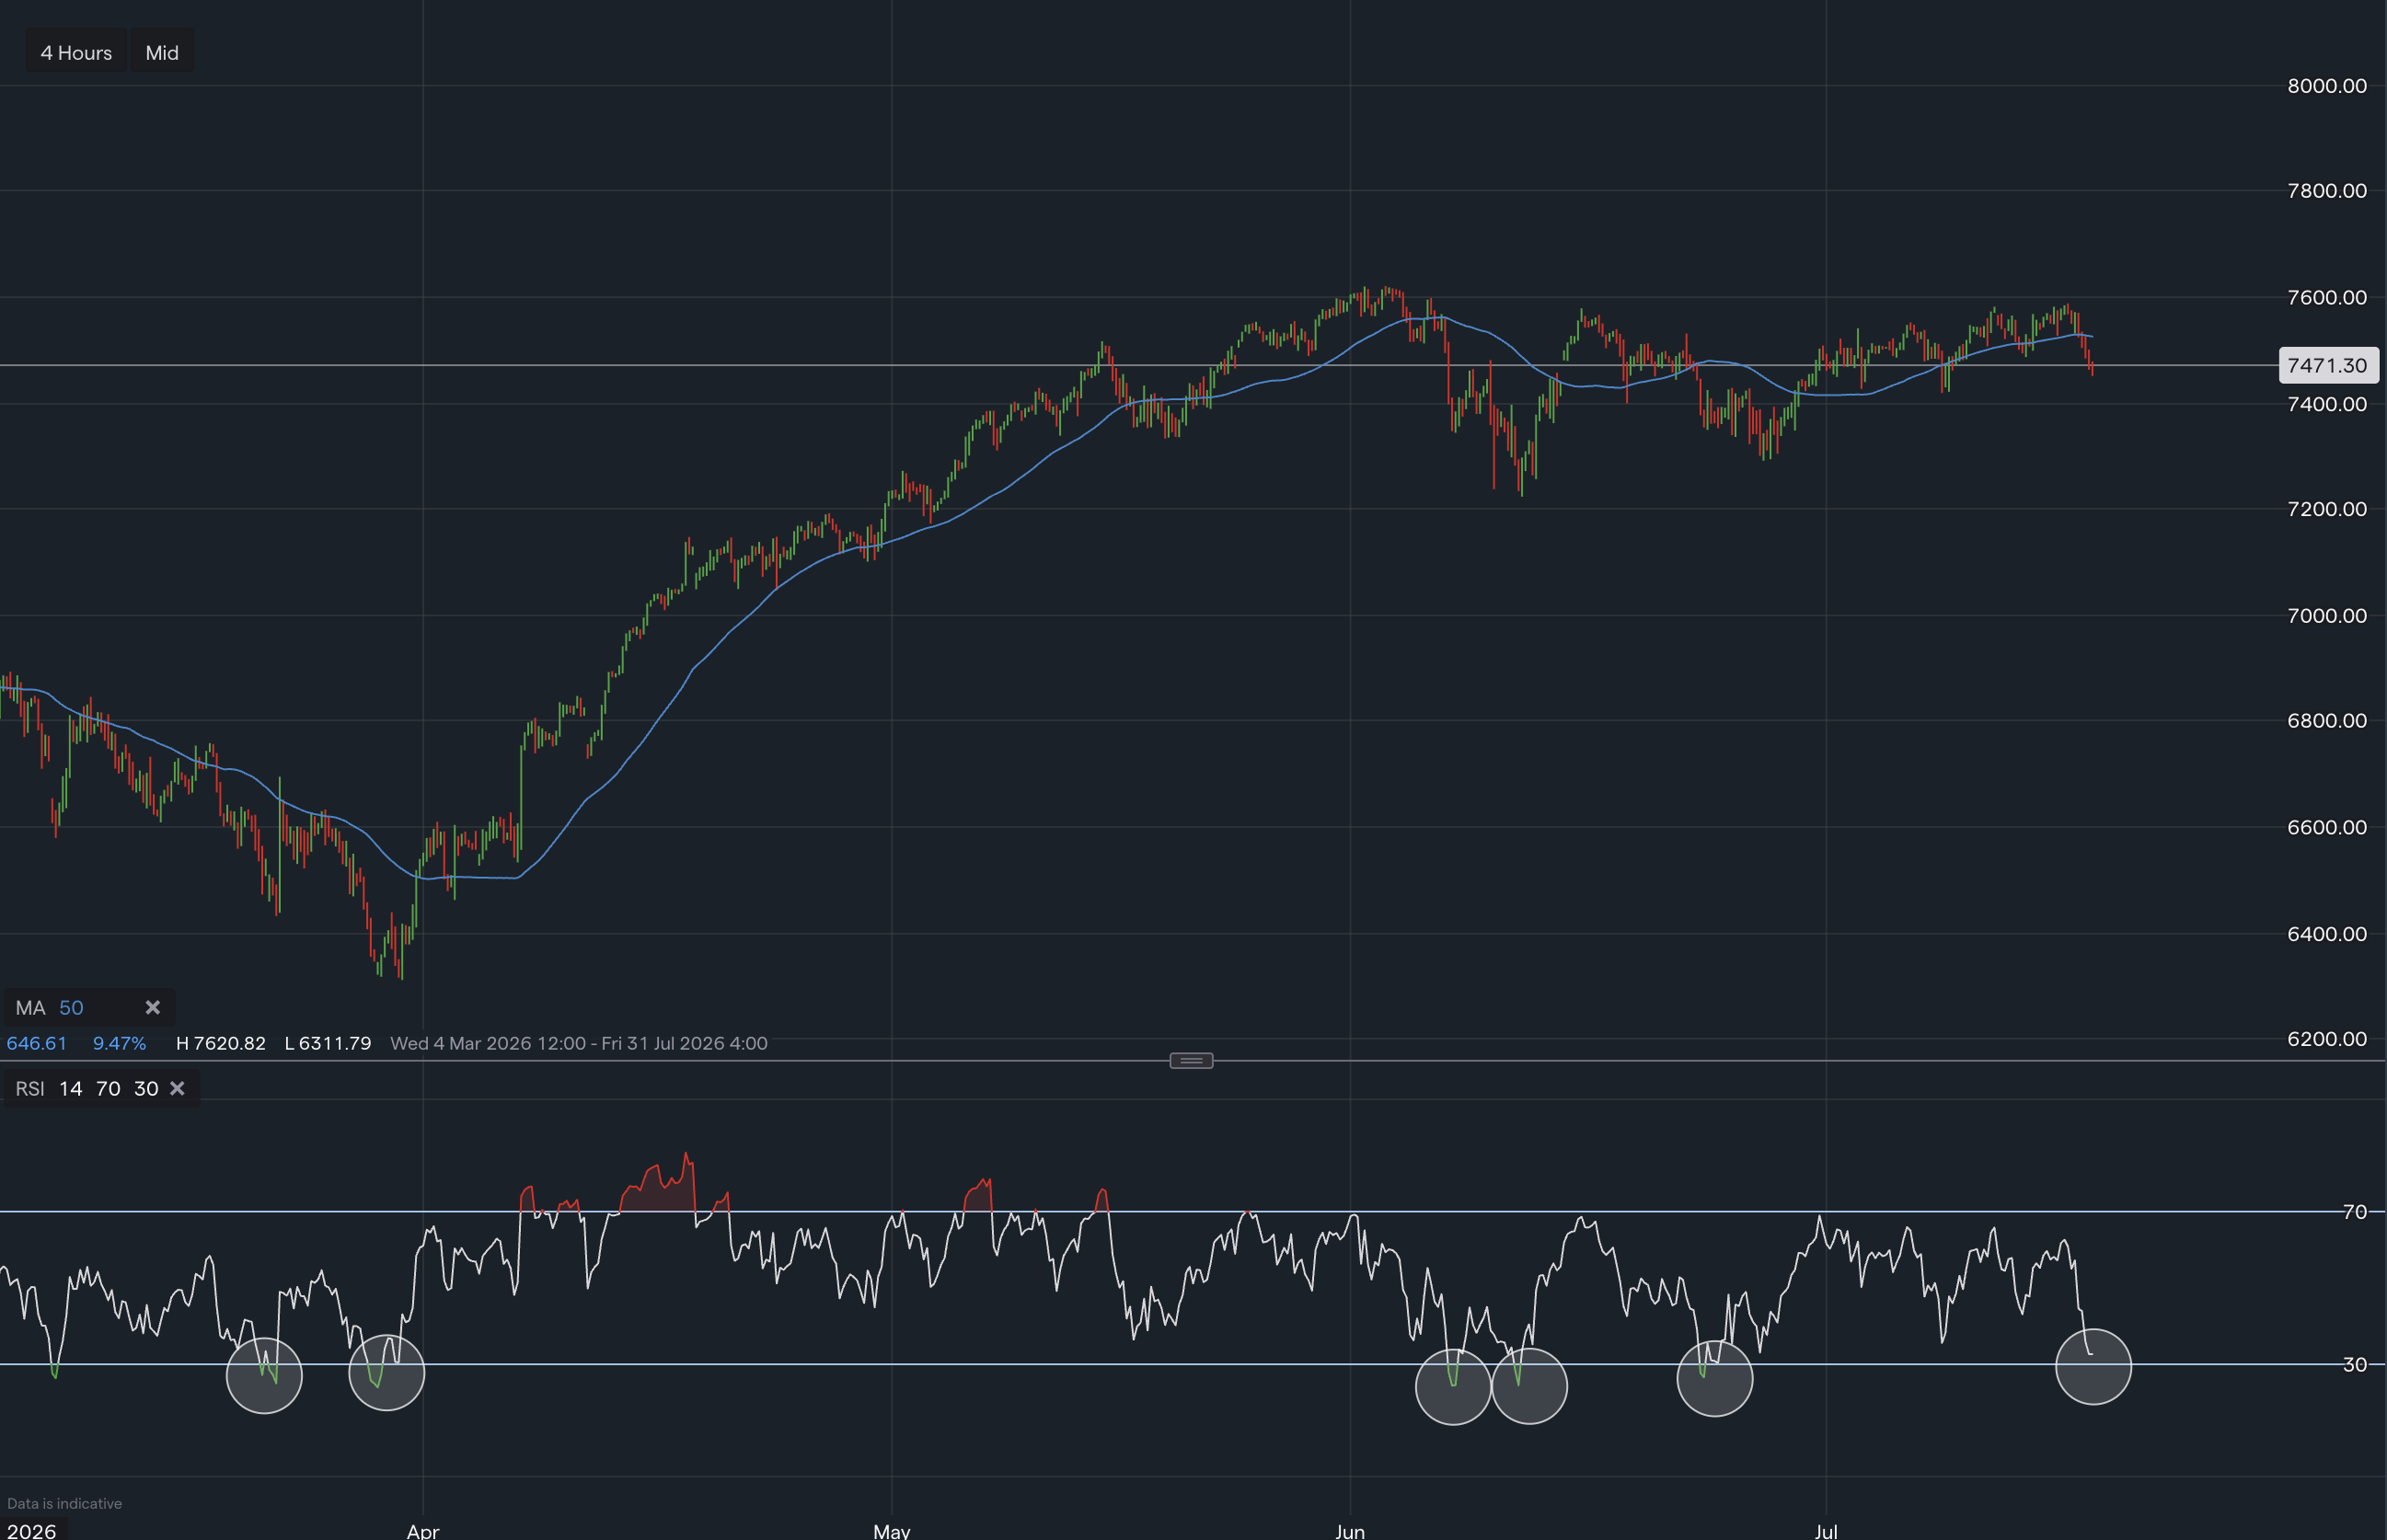
Upon further examination of the 4-hour chart suggests the price may hover around $260, with key Fibonacci retracement levels plotted. The price could test a resistance level at $267.60. The Moving Average Convergence Divergence (MACD) indicator shows the MACD line and signal line intertwined, potentially suggesting a period of consolidation or indecision. The Bollinger Bands indicate moderate volatility. Should the price fail to break above the $267.60 resistance, potential support levels to watch include the 23.6% retracement at $240.60, the 38.2% retracement at $223.89, and the 50% retracement at $210.38. A break below these levels could lead to further downside.
Analyst Ratings and Price Target
TipRanks provides a comprehensive view of analyst sentiment towards AMD. The stock receives a rating of 39, reflecting a consensus view that is largely positive. This rating is supported by 29 "Buy" and 10 "Hold" recommendations, indicating that the majority of analysts believe the stock is poised for further gains. Price forecasts range from a high of $310 to a low of $160, suggesting a potential upside supported by analyst confidence. These price targets provide a benchmark for investors to assess the potential return on investment.
Potential Scenario
Given the current technical signals on the 4-hour chart, a plausible scenario involves a price retracement towards the lower Bollinger Band or towards the support levels around $240.60-$223.89 before the stock resumes any potential upward movement. This potential pullback, if it occurs, could present a buying opportunity for investors. Investors should closely monitor price action and technical indicators to identify optimal entry points.
Disclaimer: This analysis is for informational purposes only and should not be considered financial advice. Investors should conduct their own research before making any investment decisions.

Tradable assets:
Min.Deposit:
Max Leverage:
FCA:

Rating:
 Earnings Calendar
  Economic Calendar
  VAT Calculator
  Tax Free Childcare Calculator
 Percentage Calculator
 Compound Interest Calculator
  Loan Overpayment Calculator
 Mortgage Calculator
 Credit Card Calculator
 Investing
  Economics
 Trading
  Technical Analysis
  Personal Finance
 Calculator