UnitedHealth Group Analysis: Defensive Healthcare Scale Amid Regulatory and Margin Pressures
$407.34
12 Jun 2026, 17:06
Neutral

Join Minipip Academy and access free courses in investing, trading, economics, and more.
Sign Up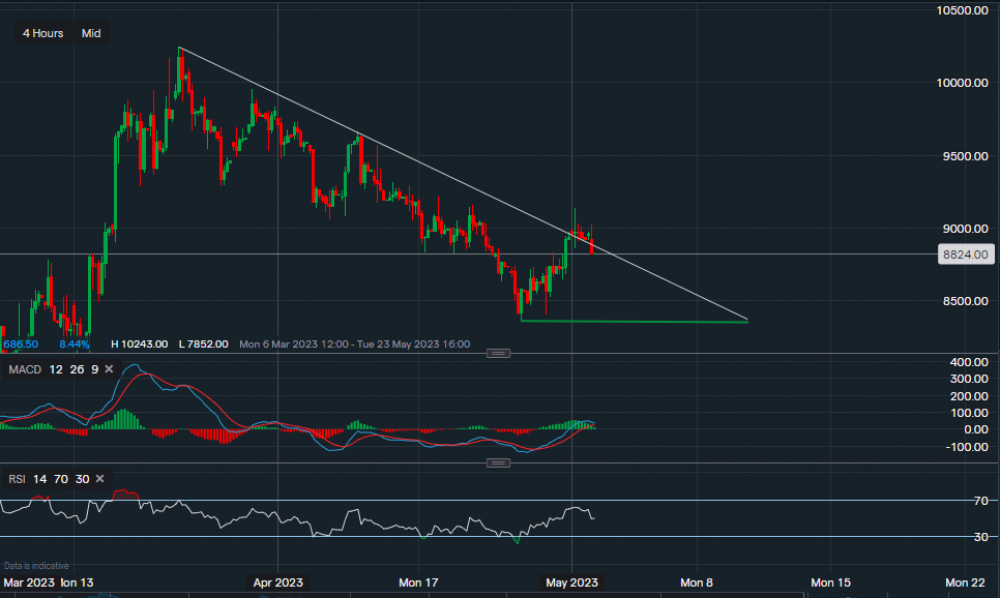
Chart & Data from IG
Taking a quick look at Advanced Micro Devices as the company is expected to report its earnings after the US market closes. Currently its stock is trading at around $88.24 a share, we can see on the 4-hourly timeframe that since the 23rd of March the price has been in a bearish trend. It has recently tried to break out of this trend but the resistance along the descending trendline seems overpowering at the moment. Resistance sits at $88.72 (along the white trendline) followed by levels at $90.28 then at $91.36. A break and close above $91.36 could suggest that a bearish trend is starting to form. Towards the downside, support sits at $86.45 followed by $85.24. A dip below these levels may see the price slide further towards the key support along the green trendline ($83.63). Looking at the technical indicators, MACD is still positive but looks like its volume is weakening and RSI is neutral as it reads 50.
 Earnings Calendar
  Economic Calendar
  VAT Calculator
  Tax Free Childcare Calculator
 Percentage Calculator
 Compound Interest Calculator
  Loan Overpayment Calculator
 Mortgage Calculator
 Credit Card Calculator
 Investing
  Economics
 Trading
  Technical Analysis
  Personal Finance
 Calculator


