Visa (NYSE:) Technical Analysis: Earnings in Focus as Bullish Momentum Builds
$364.68
28 Jul 2026, 15:59
Neutral

Join Minipip Academy and access free courses in investing, trading, economics, and more.
Sign Up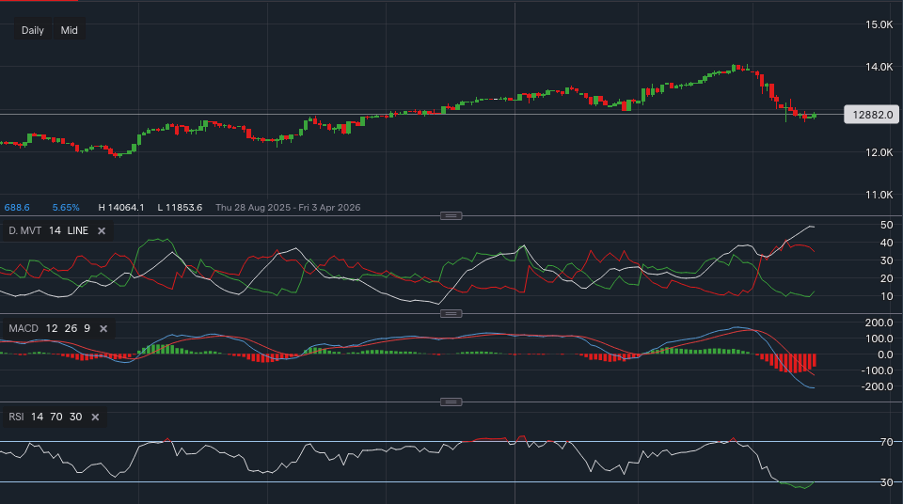
Swiss Market Index (SMI) Analysis: Bearish Momentum Persists Despite Oversold Signals
Overview
For more than three decades, investors worldwide have used the Swiss Market Index (SMI) as a benchmark for the national economy. As Switzerland’s primary equity index, it tracks the 20 largest and most liquid companies listed on the SIX Swiss Exchange. All constituents are drawn from the broader Swiss Performance Index (SPI) and together represent roughly 75% of the total market capitalisation of the Swiss equity market, making the index a key indicator of Switzerland’s premier blue-chip performance.
The index is highly concentrated in multinational corporations, particularly within the pharmaceutical and consumer sectors. The three largest components, Nestlé, Novartis, and Roche, often account for more than half of the total index weighting, meaning movements in these companies can significantly influence overall index performance. As a result of the global nature of its constituents, the SMI often behaves as a defensive equity index, typically displaying lower volatility than growth-focused benchmarks such as the S&P 500 or NASDAQ Composite.
Fundamental Context
From a macro-fundamental perspective, the SMI reflects the health of Switzerland’s export-driven economy and global pharmaceutical demand. The index composition is reviewed annually in September, while the index itself is calculated continuously in real time; market transactions trigger immediate calculations, which are used to reevaluate the constituent stocks.
Since its launch in 1988, the SMI has demonstrated strong long-term growth despite periods of global market volatility. Starting from a base level of 1,435 points in 1988, the index has risen to 13,267 points by 2025, reflecting the expansion of Switzerland’s globally dominant enterprises.
Key drivers of the index:
Technical Structure
The SMI is currently trading around 12,882, remaining within a long-term uptrend while undergoing a significant medium-term pullback.
The Relative Strength Index sits at 31.17, indicating that the market is approaching oversold conditions. However, this reading is occurring during an established downward momentum phase, meaning the indicator may remain in oversold territory until a confirmed reversal signal appears.
Trend structure on the daily timeframe presents mixed signals. The Ichimoku Cloud currently shows a consolidative regime, with price moving above and below the cloud. A thin forward green cloud suggests the potential for a minor reversal, although conviction remains weak.
On the four-hour timeframe, the Exponential Moving Average structure remains clearly bearish, with the EMA 20 below the EMA 50 and the EMA 50 below the EMA 200 (12,877 < 13,052 < 13,358). This stacked alignment indicates that short-term momentum continues to favour sellers, confirming a prevailing downward bias on the lower timeframe. However, when zooming out to the daily timeframe, the EMA structure becomes more mixed, reflecting a loss of clear directional momentum and suggesting the market may be transitioning between phases. On the weekly timeframe, the EMA stack remains bullish (20 > 50 > 200), confirming that the longer-term trend remains upward. Taken together, this multi-timeframe structure suggests that the SMI is currently experiencing a corrective pullback within a broader bullish trend that began around April 2025, with short-term selling pressure occurring inside a longer-term upward market structure.
Directional momentum indicators reinforce this outlook. The Directional Movement Index shows −DI at 34.72 versus +DI at 12.65, signalling strong selling pressure. Meanwhile, the Average Directional Index at 42.65 indicates that the current trend is strong and well established.
This bearish bias is also supported by the Moving Average Convergence Divergence, which remains deeply negative at −210.7, significantly below the signal line at −131.9, suggesting downside momentum remains dominant unless a clear bullish reversal signal emerges.
From a structural perspective, short- to mid-term resistance is forming near 12,950, a level that previously acted as support earlier in the year and may now function as a potential resistance zone if price attempts a recovery.
Conclusion
Unless a clear reversal signal emerges, such as a bullish momentum crossover, improving directional strength, or price reclaiming key moving averages, the higher probability scenario in the near term remains continued downward pressure.
Educational Disclaimer
This content is for educational and informational purposes only and should not be considered financial advice. Always conduct independent research or consult a qualified financial professional before making investment decisions.

Tradable assets:
Min.Deposit:
Max Leverage:
FCA:

Rating:
 Earnings Calendar
  Economic Calendar
  VAT Calculator
  Tax Free Childcare Calculator
 Percentage Calculator
 Compound Interest Calculator
  Loan Overpayment Calculator
 Mortgage Calculator
 Credit Card Calculator
 Investing
  Economics
 Trading
  Technical Analysis
  Personal Finance
 Calculator


