UnitedHealth Group Analysis: Defensive Healthcare Scale Amid Regulatory and Margin Pressures
$407.34
12 Jun 2026, 17:06
Neutral

Join Minipip Academy and access free courses in investing, trading, economics, and more.
Sign Up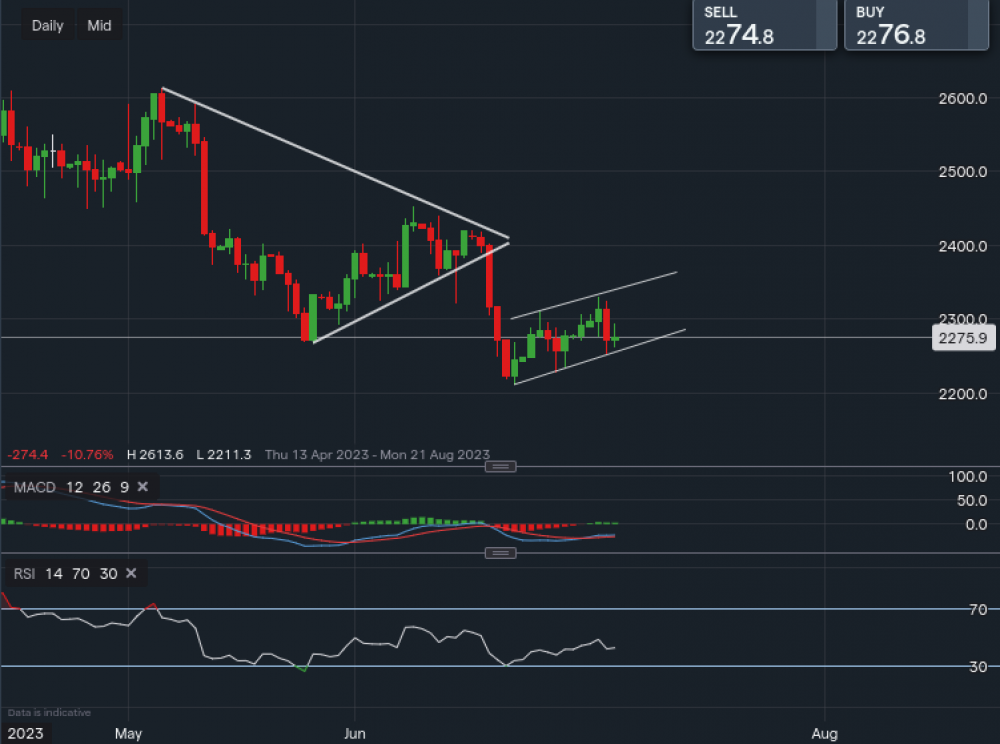
Chart & Data from IG
Taking a look at Silver as we can see that it has broken out of the triangle pattern on the daily interval (20th June), and now is trading within the channel highlighted on the chart. Currently trading at around $22.75 an ounce as we saw a negative day yesterday. Support has been created at $22.52 which is along the lower trendline of the channel, a break and close below it could see the price continue falling to support levels at $22.27 followed by the key level at $22.11. A move below $22.11 would open the door to falls reaching $21 an ounce. Commodities are struggling at the moment with inflation in some parts of the world easing, investors are putting their money back into stocks, especially tech as risk appetite is changing. We could see Silver rangebound for the next few sessions, unless the resistance level of $23.30 is broken as it may indicate that a potential move higher is upcoming. With the target then of $24 an ounce. Looking at the technical indicators, MACD is pretty flat and so is the RSI as its reading 44.

Tradable assets:
Min.Deposit:
Max Leverage:
FCA:

Rating:
 Earnings Calendar
  Economic Calendar
  VAT Calculator
  Tax Free Childcare Calculator
 Percentage Calculator
 Compound Interest Calculator
  Loan Overpayment Calculator
 Mortgage Calculator
 Credit Card Calculator
 Investing
  Economics
 Trading
  Technical Analysis
  Personal Finance
 Calculator


