UnitedHealth Group Analysis: Defensive Healthcare Scale Amid Regulatory and Margin Pressures
$407.34
12 Jun 2026, 17:06
Neutral

Join Minipip Academy and access free courses in investing, trading, economics, and more.
Sign Up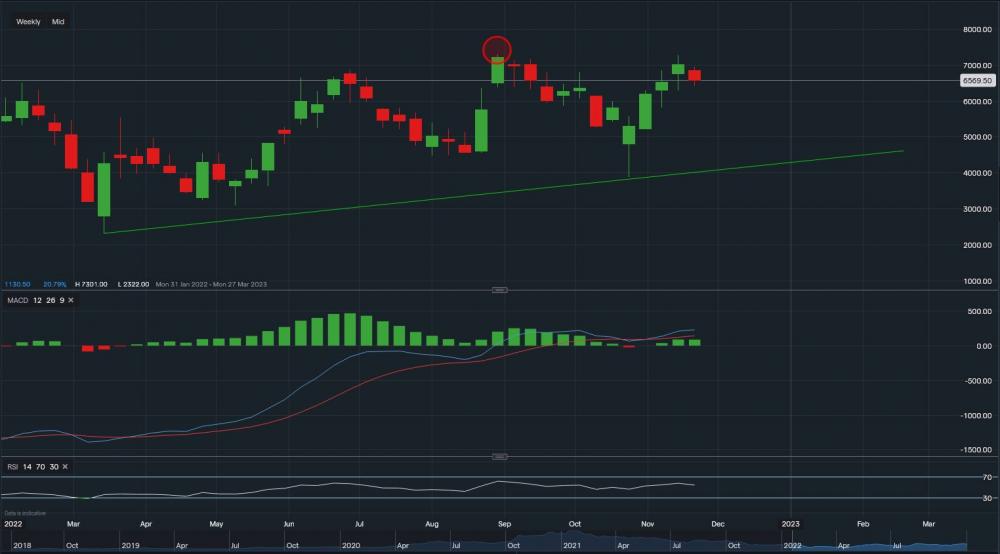
PDD - Chart & Data from IG
Overview
Pinduoduo Inc. uses technology to support and advance the traditional agricultural sector. Through its interactive social commerce buying experience, it has developed a platform that directly connects farmers and consumers. 16 million farmers sold their produce to Pinduoduo customers in 2021.
Financials
Looking at the financial year ending on the 31st of December 2021 versus 2020, revenue went up to $14.7bn from $9.1bn and gross profit went up to $9.8bn from $6.2bn. PDD has reported a positive net income of $1.2bn for the first time since 2017 and a positive EBITDA of $1.4bn. Back in 2020, it reported $-1.1bn for net income and $-1.4bn for EBITDA. As a result of the positive annual report in 2021, earnings per share came in at $0.96 versus $-0.92 in the previous year. Total liabilities in 2021 rose by $1.5bn but the increase of $4.1bn in total assets offsets this rise and more. One of the reasons for the sharper increase in assets was due to the reduction of PDD’s long-term debt. Additionally, PDD’s cash-on-hand pile rose by $2.6bn year-on-year. Due to the above, the equity of the company totalled $11.8bn in 2021 against $9.2bn in 2020.
Technicals
From a technical aspect, its share price sits at $65.69 a share. Towards the upside, resistance sits at $67.98 then at$69.51 then at $71.61. A break above these resistance points could see the stock’s share price climb towards the key resistance at $73.01 (red oval). On the other hand, towards the downside, support sits at $63.38 then at $60.76 then at $59.52. A break below these support levels may see the share price slide towards the $52-$54 price range. Looking at the indicators, MACD is currently positive and RSI is neutral but turning positive as it reads 54.
Summary
On the basis of the financials of the company, PDD is demonstrating improvements and growth year-on-year. Finally reporting positive earnings in 2021 (the first since 2017), the value of its assets outweighs its liabilities, and its cash-on-hand pile is only increasing. The company has also managed to reduce its long-term debts allowing room for more growth in the near future. The financials seem to be in an uptrend and could continue in this direction in the long term. Based on the technicals, indicators are positive and the stock has been in an uptrend since March 14th. Investors must be wary of a dip below before potentially bouncing higher.
 Earnings Calendar
  Economic Calendar
  VAT Calculator
  Tax Free Childcare Calculator
 Percentage Calculator
 Compound Interest Calculator
  Loan Overpayment Calculator
 Mortgage Calculator
 Credit Card Calculator
 Investing
  Economics
 Trading
  Technical Analysis
  Personal Finance
 Calculator


