News
News in Brief
21 Sep 2026, 16:23


Join Minipip Academy and access free courses in investing, trading, economics, and more.
Sign Up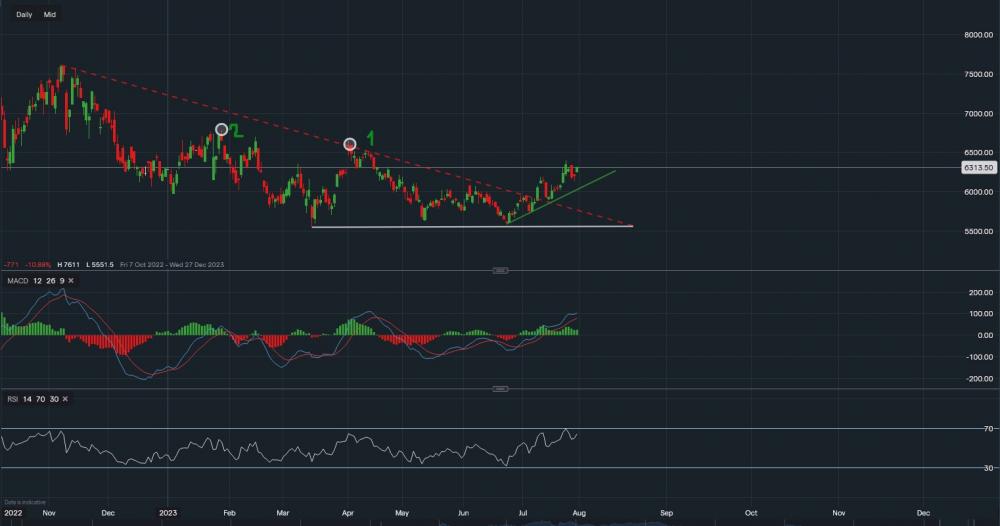
Chart & Data from IG


Taking a look at Occidental as the energy company is due to report quarterly earnings tomorrow. Currently, its stock is trading at around $63.13 a share, and we can see that the price is now comfortably in a bullish trend after breaking out of the descending triangle on July 11th. The support can be found along the green trendline with initial levels at $61.98 followed by $61.30 and then the key level at $60.61 (trendline). A break and close below the trendline may indicate a move lower towards $58.96, but given the current energy market, this would require some significant selloffs alongside extremely poor earnings. Resistance above sits at $63.96, a break above it could see the price head towards targets 1 & 2 of $66.46 and $67.92. These are highlighted by the white ovals on the chart. The bias for the time being is bullish and a positive report might provide the additional momentum for those levels to be reached. Not necessarily in a day or two, but 1-2 weeks. However, this is of course dependent on the earnings report. Looking at the technical indicators, MACD remains positive and so does the RSI as it reads 63.
 Earnings Calendar
  Economic Calendar
  VAT Calculator
  Tax Free Childcare Calculator
 Percentage Calculator
 Compound Interest Calculator
  Loan Overpayment Calculator
 Mortgage Calculator
 Credit Card Calculator
 Investing
  Economics
 Trading
  Technical Analysis
  Personal Finance
 Calculator