Visa (NYSE:) Technical Analysis: Earnings in Focus as Bullish Momentum Builds
$364.68
28 Jul 2026, 15:59
Neutral

Join Minipip Academy and access free courses in investing, trading, economics, and more.
Sign Up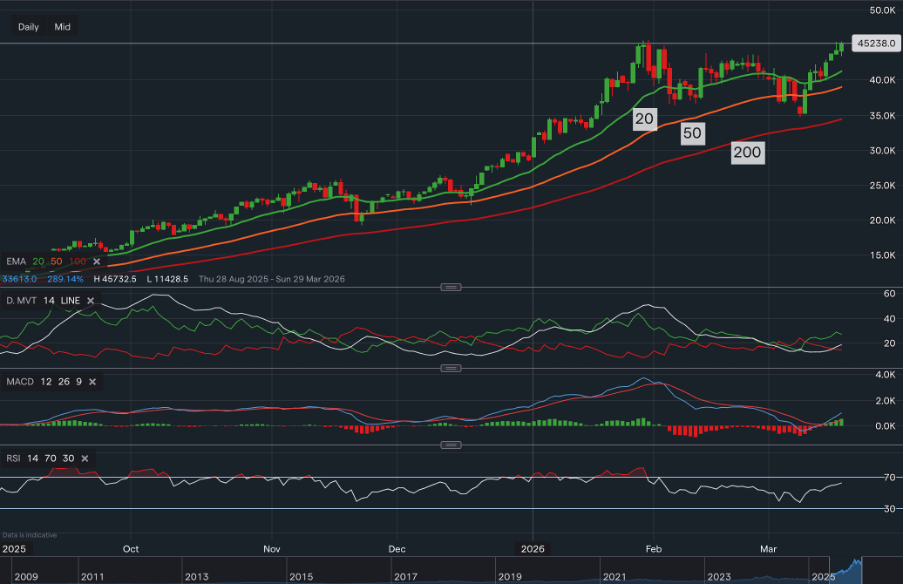
Micron Technology Stock Analysis: AI Memory Demand Drives Growth
Overview
Micron Technology, trading under the ticker MU on the NASDAQ exchange, is a technology company operating within the semiconductor industry. The firm specialises in the design and manufacture of advanced memory and storage solutions, including DRAM, NAND, and high-bandwidth memory used in data centres, artificial intelligence infrastructure, and consumer electronics.
Fundamental Snapshot
At the time of analysis, Micron Technology is trading at approximately $452.38 per share, giving the company a market capitalisation of around $505.02 billion. The stock currently carries a trailing price-to-earnings (P/E) ratio of 42.65, which appears elevated relative to historical norms and may reflect the impact of recent capital investments and the cyclical recovery phase typical of semiconductor companies. However, the forward P/E ratio of 7.86 is a sharp compression in valuation multiples based on projected earnings. Averaging the trailing and forward P/E ratios yields an estimated valuation multiple of 25.26.
Micron’s trailing twelve-month earnings currently stand at approximately $11.91 billion, with an earnings per share (EPS) of $10.52. Using the Minipip model, projected earnings implied by market expectations could reach roughly $64.25 billion, representing a huge theoretical expansion of approximately 439%. Applying the average P/E multiple to these projected earnings produces an estimated future market capitalisation of approximately $1.62 trillion, while projected EPS could rise to around $57.12, implying potential earnings growth of roughly 443%.
The significant divergence between trailing and forward valuation metrics suggests that markets are pricing in substantial earnings expansion over the coming cycles. This expectation is largely linked to accelerating demand for high-bandwidth memory (HBM) and advanced memory solutions required for data-centre infrastructure and high-performance AI computing systems.
Since the beginning of the year, Micron’s share price has climbed from approximately $264 to above $450, representing a substantial rally. This move builds upon a longer acceleration phase that began around April 2025, when the stock traded near $63, illustrating the scale of the broader market re-rating. Much of this expansion can be attributed to the rapid growth of the AI hardware ecosystem, which is driving significant demand for advanced memory technologies such as HBM used in AI accelerators and data-centre computing infrastructure.
Analyst Consensus & Market Expectations
Market sentiment toward Micron Technology remains overwhelmingly positive based on current analyst coverage. Across 26 analyst ratings, the consensus recommendation is Strong Buy, with 25 analysts recommending Buy, one suggesting Hold, and none recommending Sell.
Analyst price targets indicate a relatively wide valuation range. The highest target price stands at $650, while the lowest estimate is $330, with an average target of $461.35, implying an average projected upside of approximately 2.6%. This suggests that the market price is already trading close to the current consensus valuation.
Price Action & Technical Analysis
From a technical perspective, Micron Technology is currently displaying a strong bullish market structure across multiple indicators. The Exponential Moving Average (EMA) stack confirms a classic bullish alignment of 20 > 50 > 200, with price trading above all major averages. The EMA 20 sits at 411.62, the EMA 50 at 382.35, and the EMA 200 at 260.40, reflecting a strong upward trend across short-, medium-, and long-term time horizons.
Trend direction is reinforced by the Ichimoku Cloud, with price trading above the green cloud, indicating sustained bullish conditions. The conversion line and base line both sit at 406.27, while the lagging span remains above price at 448.84, reinforcing positive trend confirmation. Additionally, Span A (406.27) sits above Span B (369.84), further supporting the continuation of a bullish cloud structure.
Directional movement indicators also confirm bullish control. The positive directional movement (+DM) at 29.74 exceeds the negative directional movement (–DM) at 17.42, indicating buyers remain dominant in the current trend. Meanwhile, the Average Directional Index (ADX) stands at 21.8, signalling that a trend is present and gaining strength, although it has not yet reached extremely strong trend levels.
Price is currently testing and pushing above the upper Bollinger Band, suggesting strong upward momentum. The Average True Range (ATR) of 24.33 indicates elevated volatility, meaning the market currently has sufficient price range to sustain further directional movement if the trend persists.
The Moving Average Convergence Divergence (MACD) remains positive, with the MACD line at 10.51 trading above the signal line at 7.59, producing a positive histogram reading of 2.93. This configuration further implies that bullish momentum remains intact.
Finally, while the Relative Strength Index (RSI) currently sits at 61.97, approaching overbought territory, it has not yet reached the 70 threshold, indicating that the trend still has room to expand before signalling exhaustion.
From a structural perspective, support is currently located around the $362 level, which was established during the consolidation phase at the beginning of February. Meanwhile, previous resistance near $446 has recently been broken, potentially transforming this level into a new support zone if the breakout holds. This price behaviour suggests the market has entered a continuation phase within a broader uptrend, where consolidation periods allow momentum to reset before further directional movement.
Conclusion
Overall, both fundamental developments and technical market structure currently align in favour of a bullish outlook, although the magnitude of the recent price advance suggests that periods of consolidation or volatility may occur as the market digests the pace of the rally.
Educational Disclaimer
This content is for educational and informational purposes only and should not be considered financial advice. Always conduct independent research or consult a qualified financial professional before making investment decisions.

Tradable assets:
Min.Deposit:
Max Leverage:
FCA:

Rating:
 Earnings Calendar
  Economic Calendar
  VAT Calculator
  Tax Free Childcare Calculator
 Percentage Calculator
 Compound Interest Calculator
  Loan Overpayment Calculator
 Mortgage Calculator
 Credit Card Calculator
 Investing
  Economics
 Trading
  Technical Analysis
  Personal Finance
 Calculator


