UnitedHealth Group Analysis: Defensive Healthcare Scale Amid Regulatory and Margin Pressures
$407.34
12 Jun 2026, 17:06
Neutral

Join Minipip Academy and access free courses in investing, trading, economics, and more.
Sign Up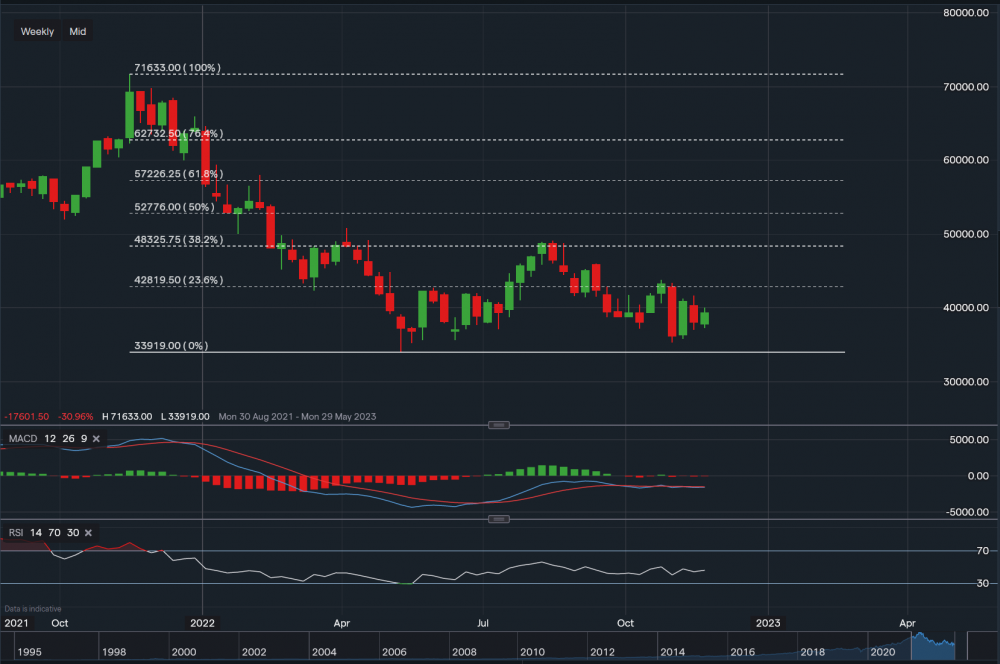
Intuit Inc - Chat & Data from IG
Overview
The American business software company Intuit Inc. specialises in financial software. The business's main office is in Mountain View, California. The software programmes offered by Intuit include the tax preparation programme TurboTax, the personal finance programme Mint, the small business accounting programme QuickBooks, the credit monitoring service Credit Karma, and the email marketing platform Mailchimp. As of 2019, its operations within the United States account for more than 95% of its revenues and profitability.
Financials
Comparing the financial year ending on the 31st of July 2022 versus 2021, in 2022 revenue rose to $12.7bn from $9.6bn and gross profit rose to $10.3bn from $7.95bn. However, net income only saw a slight increase to $2.066bn from $2.062bn, and EBITDA went up by $454m. Operating expenses rose by $2.3bn, which is why the value of net income was almost unchanged YoY. As a result of this, earnings per share came in at $7.38 for 2022, which was $0.27 lower than in 2021. Total liabilities rose by $5.6bn but total assets rose by $12.2bn, cushioning the jump in liabilities. Although, the company’s cash-on-hand stockpile lowered by $589m, nevertheless, its shareholder equity hiked to $16.4bn from $9.9 YoY.
Technicals
From a technical perspective, Intuit’s shares are currently trading at $392.59 a share. Applying the Fibonacci retracement to the chart, towards the upside, resistance sits at $416.37 (just below the 23.6% fib) then at $428.19 (correspondent with the 23.6% fib) then $459.41, which is based in between the 23.6% and 38.2% fib retracements. A break above the $459.41 price could see the stock climb towards the key resistance point at $483.25 (38.2% fib). Towards the downside, support sits at $369.84 then at $352.68 then a major support level at $339.19 (0% fib). A break below the major support could see the share price fall towards the $300-$310 price range. Looking at the indicators, MACD is neutral and so is RSI as it reads 46.
Summary
Based on the financials above, the company’s net income saw minimal to zero change and earnings per share came in at $0.27 lower than in the prior year. This was primarily due to the increase in operating expenses. However, the company is generating more revenue and profit year-on-year, and the rise in assets outweighs the rise in liabilities by a much bigger margin with EBITDA increasing by almost $0.5bn. The cash-on-hand value saw a drop but shareholder equity jumped by $6.5bn, so there seems to be a mixed trend in the financials of the company. From a technical overview, the indicators are currently in a neutral position, but it appears like there is an established support base below. There is potential for more upside towards the 23.6% fib level in the mid/long term, but that is dependent on whether the support holds.
 Earnings Calendar
  Economic Calendar
  VAT Calculator
  Tax Free Childcare Calculator
 Percentage Calculator
 Compound Interest Calculator
  Loan Overpayment Calculator
 Mortgage Calculator
 Credit Card Calculator
 Investing
  Economics
 Trading
  Technical Analysis
  Personal Finance
 Calculator


