UnitedHealth Group Analysis: Defensive Healthcare Scale Amid Regulatory and Margin Pressures
$407.34
12 Jun 2026, 17:06
Neutral

Join Minipip Academy and access free courses in investing, trading, economics, and more.
Sign Up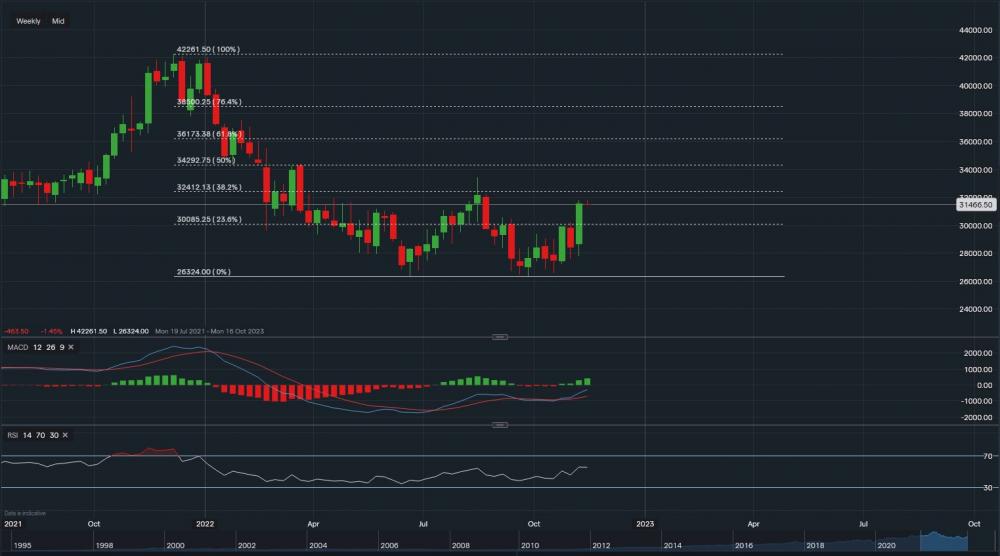
Home Depot Inc - Chart & Data from IG
Overview
Home Depot Inc is an American international home improvement retail company that sells appliances, construction products, tools and services. It is the largest home improvement retailer in the United States. It is traded on the New York Stock Exchange and it is a constituent of the Dow Jones index. The company is headquartered in Georgia, Atlanta, in the US.
Financials
Net sales for the 2021 financial year increased by $19bn (14.4%) to $151.20bn. The increase in net sales was mainly due to sales driven by sales from HD Supply and by an increase in comparable average tickets. As a result, in 2021 gross profit rose $6bn (13.3%) to $50.8bn. After the deduction of all operating expenses, which includes depreciation and amortisation, operating income totalled $23.040bn, an increase of $4,762 from the previous year. Additionally, earnings per share were $15.53 for 2021 versus $11.94 in 2020, one factor for the rise was share repurchases. Furthermore, total assets rose by $1,295bn but total liabilities also rose by $6,290bn. This was due to acquiring more short-term debt as well as long-term, and a rise of $1,856bn in accounts payable. Finally, cash and cash equivalents fell by $5,552bn to $2,343, as the company used $19,120bn in financing activities versus only $2,983bn used in 2020.
Technicals
From a technical aspect, Home Depot’s share price currently sits at $314.66 a share. Towards the upside, resistance sits at $324.12 (38.2% Fib) then at $334.42 (below the 50% Fib), then a major resistance level at $342.92 (50% Fib). A break above the 50% Fibonacci retracement could see the stock climb towards the 61.8% Fib and begin to recover some of the losses obtained since the start of 2022. However, this is more likely in the long term. On the other hand, towards the downside, support sits at $300.85 (23.6% Fib). A break below the 23.6% Fib may see the stock lose all of October’s gains and decline further towards the major support level at $263.24 (0% Fib). Although, this is more likely in the mid/long term. Looking at the indicators, RSI reads 55 suggesting positive and MACD is also positive.
Summary
The financials highlight a gradual growth year-on-year, with a healthy rise in sales and profit leading to an increase in operating income. As a result, earnings per share rose by $3.59 a share. Total liabilities did come in much higher than total assets as the company took on more debt, both short and long-term. As well as a jump in accounts payable. Furthermore, cash and cash equivalents also fell in 2021 due to the reason of using $16,137bn more on financing activities than in fiscal 2020. This included $14.809bn worth of repurchases of common stock. Overall, the company seems to be making solid improvements YoY with gradual increases within their financial operations and based on the technical approach, indicators are suggesting more upside. However, Home Depot is expected to report its quarterly earnings on the 15th of November. The company is expected to report earnings of $4.12 a share on revenue of $37.92bn. A stronger-than-expected report could see the stock edge higher, whereas a lower-than-expected report may see the share price slump.
 Earnings Calendar
  Economic Calendar
  VAT Calculator
  Tax Free Childcare Calculator
 Percentage Calculator
 Compound Interest Calculator
  Loan Overpayment Calculator
 Mortgage Calculator
 Credit Card Calculator
 Investing
  Economics
 Trading
  Technical Analysis
  Personal Finance
 Calculator


