UnitedHealth Group Analysis: Defensive Healthcare Scale Amid Regulatory and Margin Pressures
$407.34
12 Jun 2026, 17:06
Neutral

Join Minipip Academy and access free courses in investing, trading, economics, and more.
Sign Up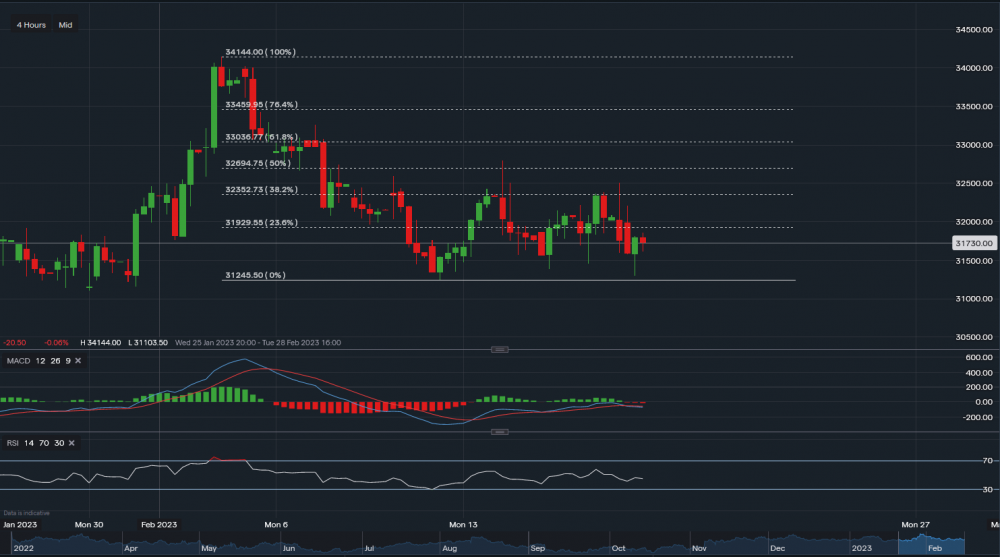
Home Depot - Chart & Data IG
Financials
Comparing the 2022 fiscal year to 2021, total revenue grew by $19bn (or 14.4%) to $151bn and gross profit grew by $6bn (or 13.3%) to almost $51bn. This rise was mainly driven by sales from HD Supply and by an increase in comparable average tickets. After the deduction of tax and operating expenses, which includes amortisation and depreciation, net income totalled $16.4 for the year. As the net profit rose $3.6bn and EBITDA rose $5bn year-on-year, earnings per share jumped to $15.99 compared to $11.98 in 2021. One factor for the rise was share repurchases. Looking at the balance sheet, cash-on-hand fell by $5bn, but this was mainly because it was used for inventory. So, the balance actually remained the same as it has been for the past decade. However, the increase of $6.3bn in total liabilities overshadowed the increase of $1.3bn in total assets. This was due to acquiring more short-term debt as well as long-term, and a rise of $1,8bn in accounts payable. As a result, equity has been reported at a loss of $-1.7bn for 2022. Yet still, it’s at the highest it’s ever been ($71.8bn).
Technicals
Home Depot’s shares are trading at around $317.30 a share. Applying the Fibonacci retracement on the 4-hourly timeframe, we can see that a base of support has formed below. With the key support level sitting at $312.45 (0% Fib). A break and close below this level could indicate further downside and see the price slide towards the $305-$307 price range. On the other hand, as the price is still rangebound and there isn’t a clear direction, the upside resistance sits at $319.29 (23.6% Fib). A break above the 23.6% Fib may test the 38.2% ($323.52) and the 50% Fib ($326.94) resistance. The MACD on the 4-hourly is neutral and the RSI is marginally negative as it reads 44.9.
Summary
On the basis of the financials, the revenue and profit continue to grow due to successful operations. Cash-on-hand did fall but as mentioned above, it was used for inventory for the following fiscal year to generate further income and growth. The rise in liabilities was greater than the rise in assets, hence, the decline in equity. Although, equity remains at an all-time high of $71.8bn. Over to the technical, the Fibonacci retracement highlights the resistance levels that would require beating before any further upside trend is visible. At this moment in time, the price is pretty rangebound between $312-$323. Note to investors: HD is expected to report quarterly earnings tomorrow of $3.28 on revenue of $35.96bn (before the market opens). This should provide more insight for investors in the upcoming months.
 Earnings Calendar
  Economic Calendar
  VAT Calculator
  Tax Free Childcare Calculator
 Percentage Calculator
 Compound Interest Calculator
  Loan Overpayment Calculator
 Mortgage Calculator
 Credit Card Calculator
 Investing
  Economics
 Trading
  Technical Analysis
  Personal Finance
 Calculator


