News
NVIDIA Faces Uncertainty as CEO Jensen Huang Resigns Ahead of Crucial Earnings Report
13 Nov 2026, 16:54


Join Minipip Academy and access free courses in investing, trading, economics, and more.
Sign Up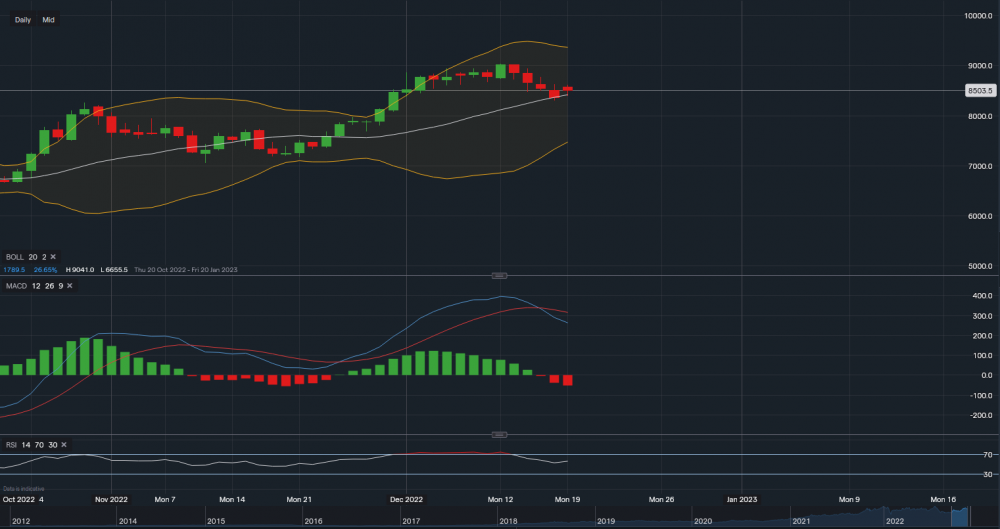
Carbon Emissions - Chart & Data from IG


From a technical outlook, carbon is currently trading at around €85.03. Applying the Bollinger Bands to the chart, carbon has been in a bearish trend since Tuesday 13th of December with support levels now sitting at €84.17 (correspondent with the moving average of the Bollingers) and then at €83.07. A break below the MA of the Bollingers and €83.07 could see the price of carbon fall towards the low 80s. However, if the bullish trend from the back end of October is to continue, resistance sits at €86.12 then at €87.71 then at €88.63. A break above these levels may see the price of carbon head back towards that €90 level seen last week. Looking at the indicators, MACD is currently negative but RSI remains slightly positive as it reads 55.
 Earnings Calendar
 Economic Calendar
 VAT Calculator
 Tax Free Childcare Calculator
 Percentage Calculator
 Compound Interest Calculator
 Loan Overpayment Calculator
 Mortgage Calculator
 Credit Card Calculator

 Investing
 Economics
 Trading
 Technical Analysis
 Personal Finance
 Calculator