UnitedHealth Group Analysis: Defensive Healthcare Scale Amid Regulatory and Margin Pressures
$407.34
12 Jun 2026, 17:06
Neutral

Join Minipip Academy and access free courses in investing, trading, economics, and more.
Sign Up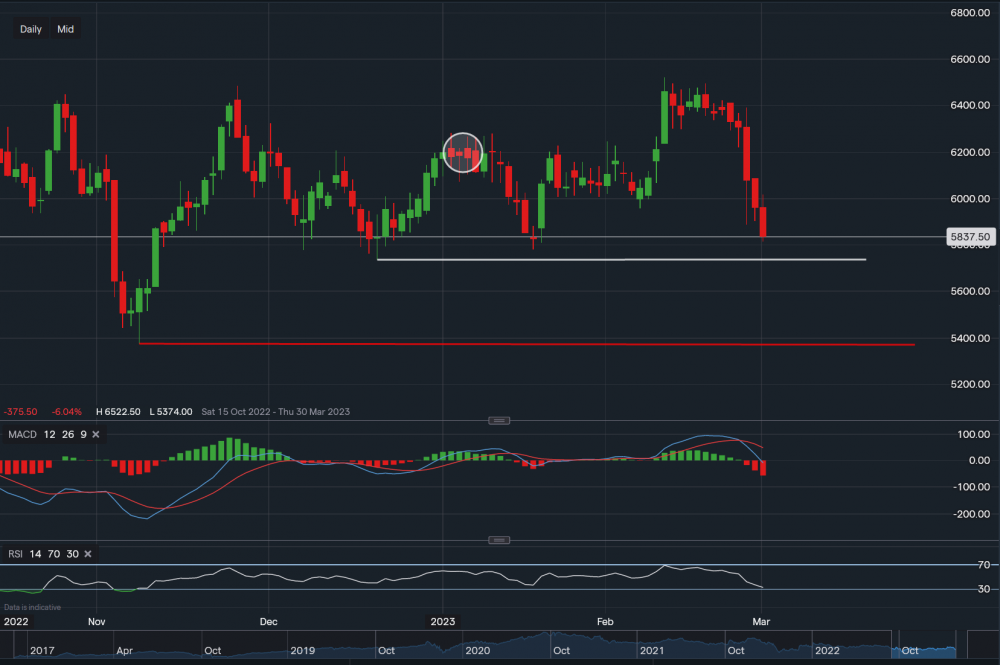
Black Knight - Chart & Data IG
Overview
Black Knight is an American company that offers integrated technology, services, data, and analytics to the mortgage lending, servicing, and real estate industries as well as the capital and secondary markets. Jacksonville, Florida serves as the location of the company's headquarters.
Financials
Taking a look at the firm’s annual earnings, total revenue grew to $1.47 billion and gross profit grew to $681 million for the fiscal year 2021. The net income after tax and expenses came in at $207 million, which is $57 million less than it was in 2020. The primary cause for this was due to a rise in operating expenses, operating expenses increased by $76 million since 2020. There was an increase in EBITDA of $131 million, but the earnings per share still fell 23% annually to $1.34. Over to the balance sheet, cash on hand sits at $77 million. This figure is greater when compared to years since 2017, however, it's still 42% lower than in 2016 and 58% lower than in 2015. The company’s total assets rose by $260 million but total liabilities rose by almost $800 million, as a result, the firm lost $537 million in equity. One of the reasons for such a rise in liabilities was as Black Knight took on additional longer-term debt.
Technicals
We can see that Black Knight’s shares are currently trading at around $58.37 a share. We can also see that its stock price is approaching an important support level, the support level rests at $57.36 (white trendline). A break below this support level could see a continuation of this recent bearish trend, falling as low as $53.74 (red trendline), which would be a major test for the future of this stock. However, let’s not be too pessimistic. We can see that on the 20th of December last year and on the 19th of January this year, there was a bounce higher towards the upside beating the previous highs. Therefore, this may be an opportunity for history to repeat itself. Resistance now sits at $58.81 then at $59.32. A break above these levels may see the price edge higher towards the $61-$62 range, which is the cluster point in the ‘w’ shape lookalike (white oval). MACD is negative and so is RSI, although RSI is floating above ‘oversold’ territory as it reads 32.
Summary
To summarise, the financials are very mixed at this moment in time. The revenue and gross profit continue to gradually grow year-on-year, but as highlighted above, due to a rise in operating expenses the net profit has actually fallen. Perhaps, jumping on the current hype of job cutting, they could cut employee numbers as a way to reduce their expenses for the following fiscal year. This is just an example of a business strategy. Additionally, their cash on hand is growing but the firm took a hit regarding its equity as liabilities overshadowed assets in 2021. So there seems to be a mixture of pros and cons, but there are areas that certainly need improvement. Based on the technicals, as already mentioned, the price is approaching a key support level. The indicators do suggest further downside but with the RSI floating above the oversold territory, and looking at the previous falls that led to sharp turnarounds, a similar pattern could occur. Though investors should be wary of past trends as they’re not always accurate and should set stop losses where necessary.
 Earnings Calendar
  Economic Calendar
  VAT Calculator
  Tax Free Childcare Calculator
 Percentage Calculator
 Compound Interest Calculator
  Loan Overpayment Calculator
 Mortgage Calculator
 Credit Card Calculator
 Investing
  Economics
 Trading
  Technical Analysis
  Personal Finance
 Calculator


