Accenture PLC (ACN) - Technical Analysis
$271.56
15 Dec 2025, 14:05
Neutral

Chart & Data from IG
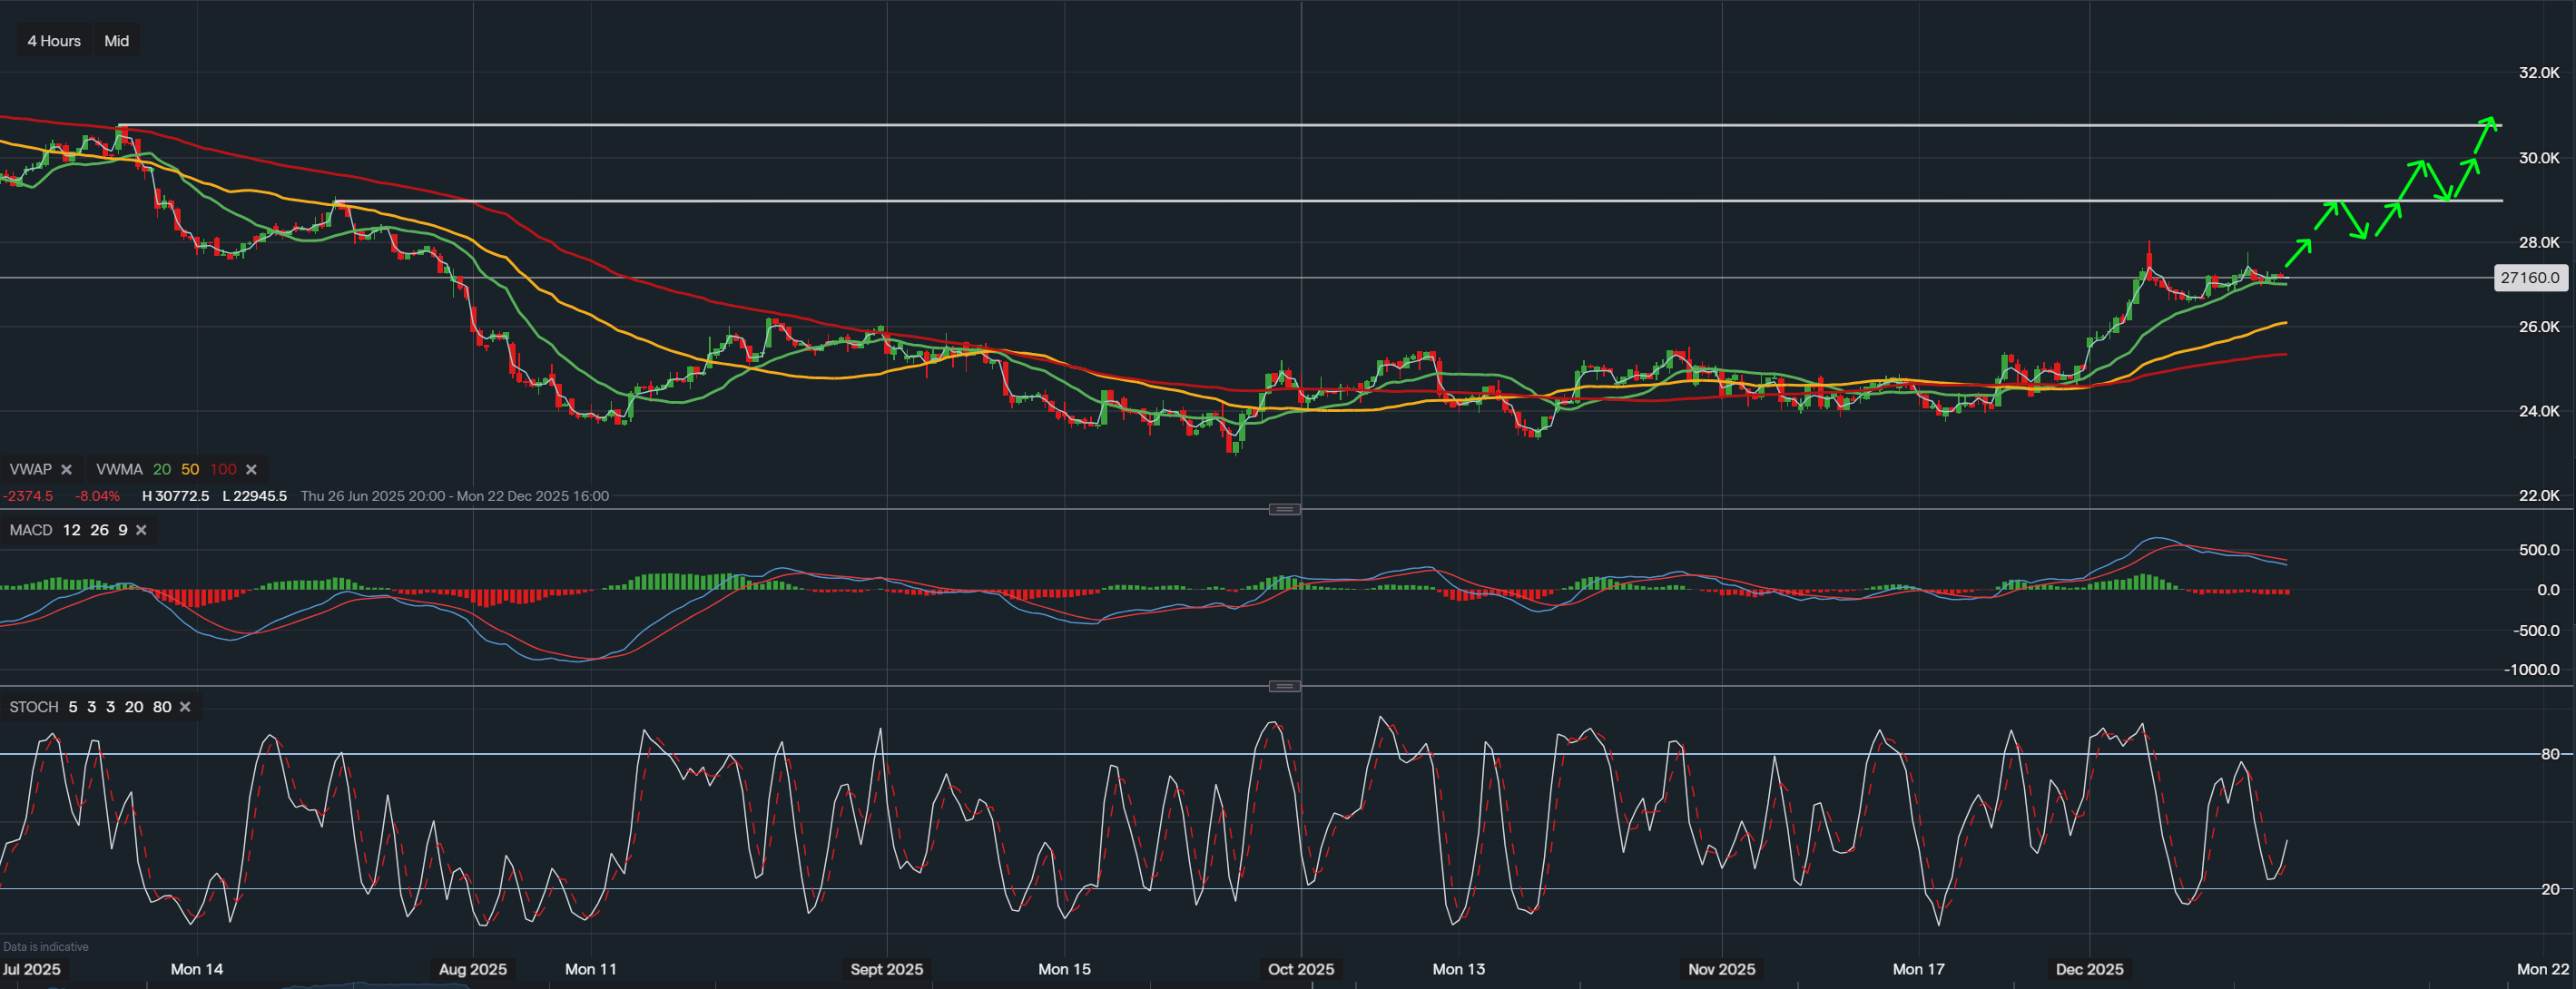
As markets await the upcoming Federal Reserve interest rate decision and renewed US-China trade negotiations, the S&P 500 (SPX) finds itself at a potentially pivotal level on the weekly chart.
Currently trading around 5,628, the index is navigating a critical technical zone for May 2025. A closer look at the chart reveals that the 50-day moving average (50MA) and the middle Bollinger Band are now acting as immediate resistance levels.
The 50-day moving average is currently at 5,701, while the Bollinger Band midpoint stands at 5,756.
Last week, the S&P 500 briefly tested the 5,700 level before retreating, indicating sellers are stepping in at this resistance zone.
This suggests there may still be short-term upside potential, but any continuation of the recent rally could be limited.
With no confirmed breakthrough in US-China trade talks and lingering geopolitical tensions, investor caution appears to be setting in. Combined with potential profit-taking after the recent run-up, the index faces elevated risk of a pullback.
Stochastic indicators are also flashing overbought signals, further supporting the case for a near-term consolidation.
Key support levels to watch are around 5,400 and 5,200, which may serve as downside targets if selling pressure increases.
The combination of:
Uncertainty around tariff agreements,
The Fed's upcoming rate decision, and
Signs of technical exhaustion
...is creating a cautious backdrop for equities in the near term.

Tradable assets:
Min.Deposit:
Max Leverage:
FCA:

Rating: