Oracle Stock Analysis: Is Oracle (ORCL) Poised for a Reversal?
$181.25
18 Dec 2025, 16:17
Bullish
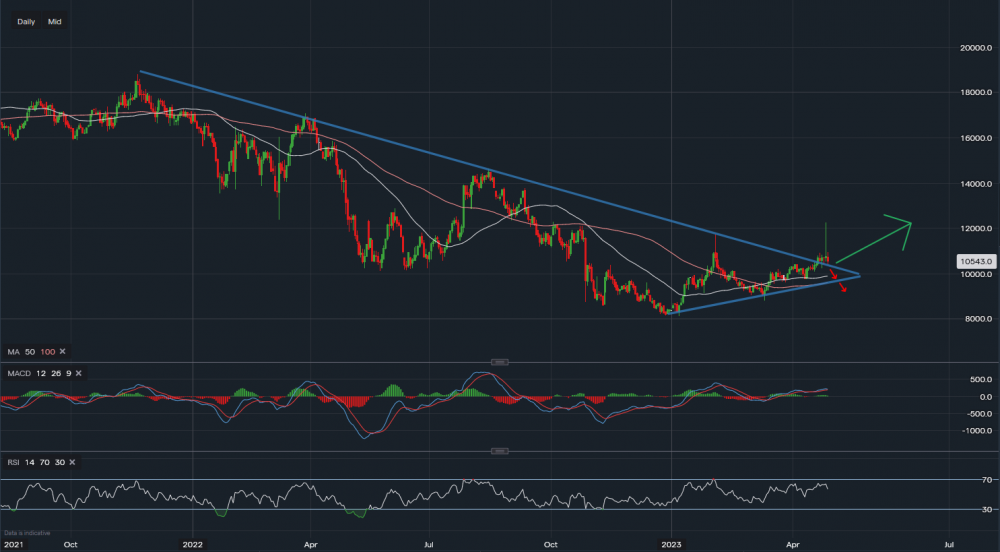
Chart & Data from IG
The E-commerce giant jumped nearly 17% yesterday after earnings proved a solid bet against analyst forecasts. Revenue for the quarter was $127.4bn (+9% YoY) with a net profit of $3.17bn, higher than the $2.24bn forecast. However, the stock soon retraced all gains and more after senior management suggested a weaker Q2 - though what's crucial for investors is that they understand the stock is now pricing in a worse Q2 and therefore a possible beat on forecasts in July could be phenomenal for the stock. 27,000+ layoffs which are happening now could be somewhat reflective in profitability in Q2.
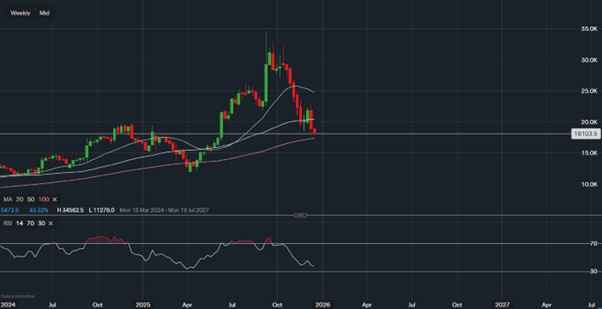
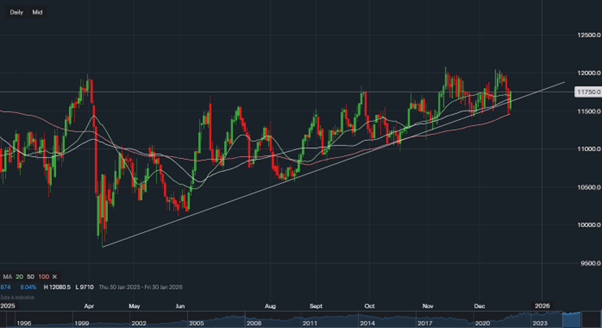
Looking at the technical chart, it's evident to us that Amazon has broken out of the nearly 15-month downtrend and while consolidation is possible though further downside to sub $80 seen in 2022 seems somewhat unlikely. Earnings beat the estimations and while growth did slow, they didn't contract, and at the level Amazon operates that's really impressive.
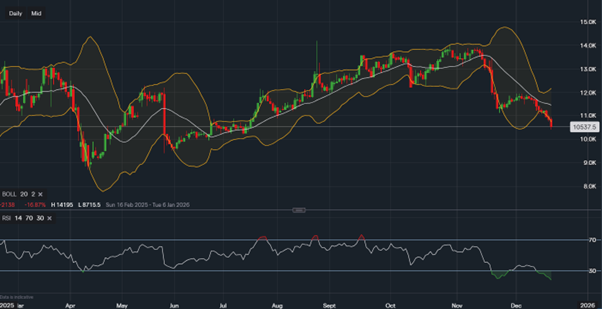
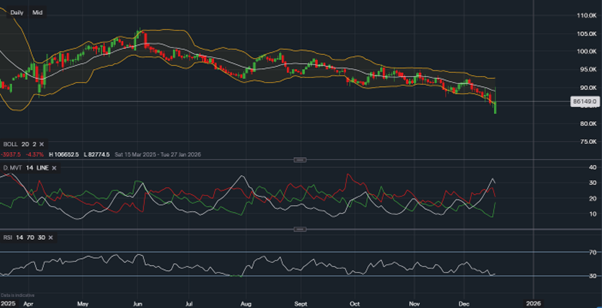
Support for the stock sits at around the $100-$103 region. Further declines from here could see Amazon fall to $98 and then $96. The further downside from there could see Amazon drop to $80 which would be the technical medium/long-term floor. Towards the upside, resistance sits at $117, followed by the after-hours high at $122. A break above here takes Amazon to $135. MACD is trending slightly positive with RSI reading 59 but showing quite a dip - thus something to consider.
Investors need to understand how many industries Amazon have an influence in. They sell everything and anything with assistance from 3rd parties as well, can control trends and consumer behaviour as well as see ahead of the market before anyone else can. They have a streaming and music service, a forefront cloud service which has the largest market share, Twitch, Ring! doorbells and so much more.